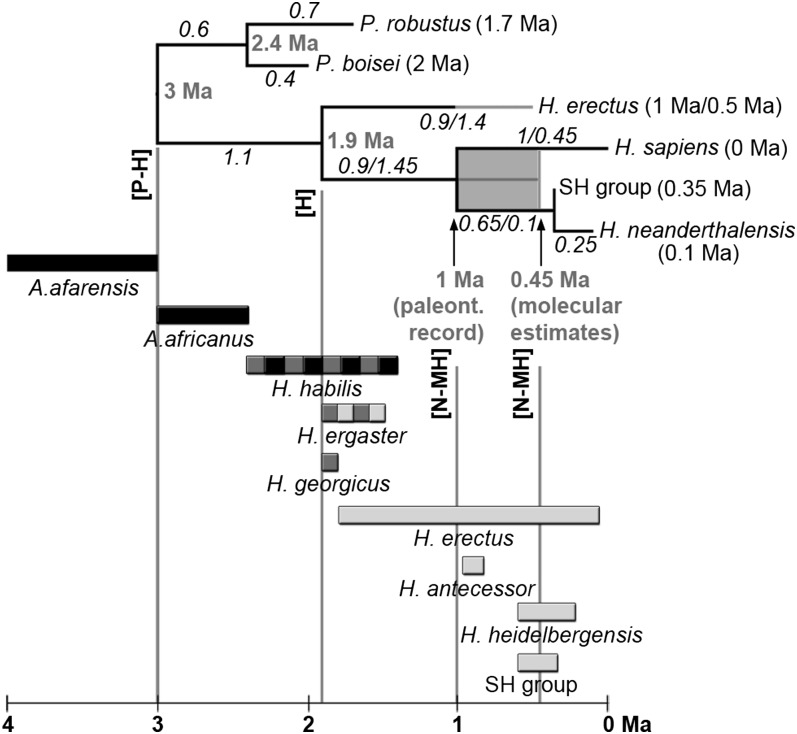
Fig. 1.
Phylogeny used for ancestral state reconstruction and candidate species. Numbers in parentheses represent the averaged chronology of the corresponding species (although see ref. 56); italic numbers represent branch lengths in millions of years; bold gray numbers represent ages of nodes. Branch lengths corresponding to a 1-Ma divergence between Neanderthals and modern humans are represented to the left of the slashes and values corresponding to a 0.45-Ma divergence to the right. H. erectus has been dated to 1 Ma (values before the slash in the H. erectus branch) or to 0.5 Ma (values after the slash). Candidate species are represented below the phylogenetic tree with bars showing their approximate temporal spans (black, candidates for the [P-H]LCA; dark gray, candidates for the [H]LCA; light gray, candidates for the [N-MH]LCA). H. erectus and the SH group have been included in the framework phylogeny in four (H. erectus) and six (SH) phylogenetic scenarios (Fig. S1) and evaluated as candidate species in the remaining scenarios. H. ergaster has been evaluated as a candidate species for the [H]LCA and the [N-MH]LCA. H. habilis has been evaluated as a candidate for the [P-H]LCA and the [H]LCA. Vertical guides indicate the age of the evaluated nodes. Fig. S1 shows individualized representations of the 12 phylogenetic topologies.

