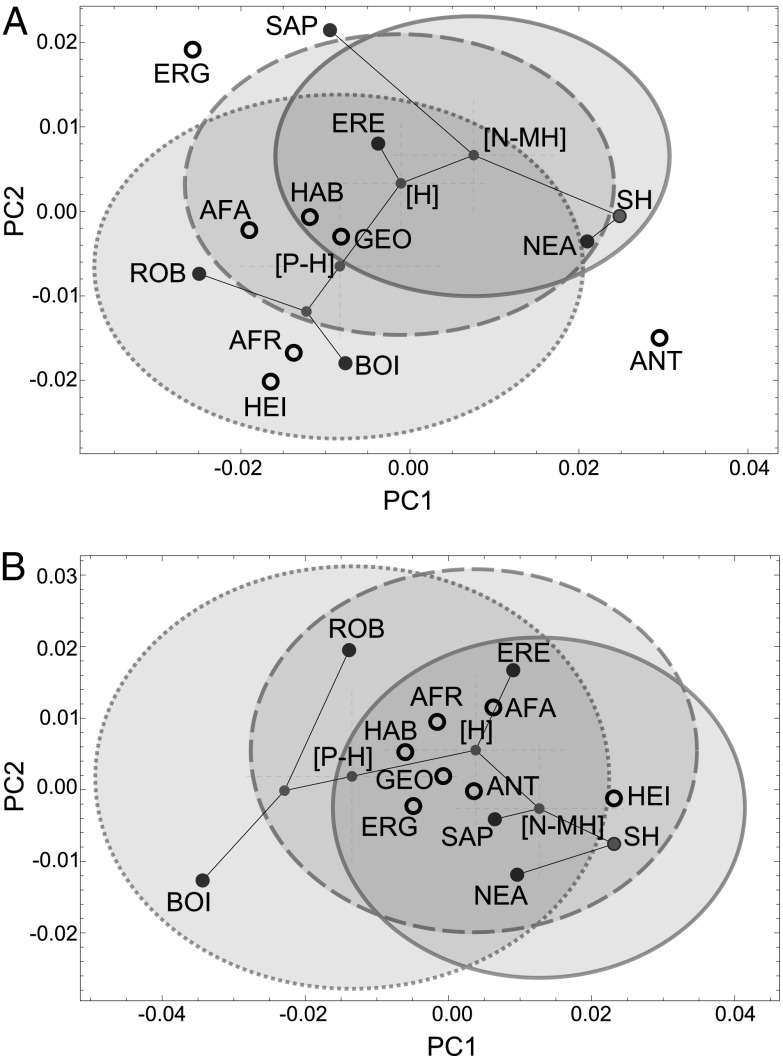
Fig. 3.
Projection of the simplified hominin phylogenetic tree (represented by lines connecting terminal species and nodes) with terminal species (large dark-gray filled circles), ancestor shapes (small light-gray filled circles) and candidate species (open circles) into the upper and lower first molar morphospaces. Confidence ellipses (95%) around the three nodes discussed in the text are represented with the three ancestors located in their centers (solid line, confidence ellipse of the [N-MH]LCA; dashed line, confidence ellipse of the [H]LCA; dotted line, confidence ellipse of the [P-H]LCA). (A) Upper first molar morphospace. (B) Lower first molar morphospace. Plots corresponding to premolars and second and third molars are provided in Fig. S4. Note that confidence ellipses in these graphs correspond only to the first and second principal components (PCs), whereas P values in Table 1 are based on all of the PCs. Phylogeny: BOI, P. boisei; ERE, H. erectus; NEA, H. neanderthalensis; ROB, Paranthropus robustus; SAP, H. sapiens; SH, SH group. Candidates: AFA, A. afarensis; AFR, A. africanus; ANT, H. antecessor; ERG, H. ergaster; GEO, Homo georgicus; HAB, H. habilis; HEI, H. heidelbergensis.

