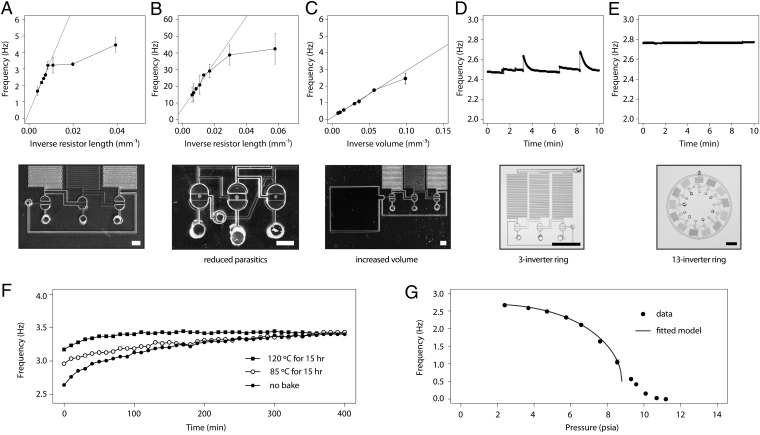
Fig. 3.
Oscillator characterization and optimization. (A) Oscillator frequency scales linearly with the inverse of the pull-up resistance, until plateauing at ∼5 Hz. (B) With reduced parasitic resistance, oscillator frequency reaches almost 50 Hz before plateauing. (C) Frequency also scales linearly with inverse volume. For A–C, error bars denote SD across three devices. (Scale bars, 1 mm.) (D) Frequency variance of three-inverter oscillator over 10 min is 1.4% SD. (E) Frequency variance of 13-inverter oscillator is only 0.1% SD. (Scale bars for D and E, 5 mm.) (F) Frequency drift averaged 4%/h in untreated oscillators, but thermal curing reduced drift to <1%/h. (G) Oscillator frequency as a function of supply vacuum pressure. Error bars denote SD across three trials. The fitted curve represents Eq. 6 plotted with variables chosen as follows: Ptc = 13.92, Pto = 8.8, RoVo = 0.820, RcVc = 0.205, and n = 3.

