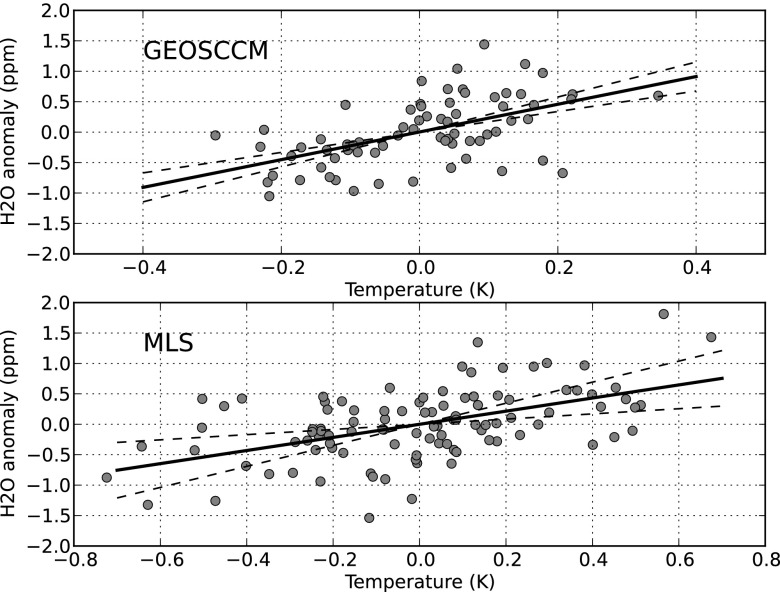
Fig. 3.
Scatter plots of (Upper) GEOSCCM annual-average lowermost stratospheric H2O (200-hPa mixing ratio, averaged between 50°N and 90°N) vs. extratropical tropospheric temperature (500-hPa temperature, averaged between 30°N and 90°N) and (Lower) the corresponding scatterplot of MLS monthly average H2O vs. MERRA temperatures. For these plots, the GEOSCCM data have been filtered to remove long-term (>10 y) variations. The solid line is the least-squares fit, and the dashed lines are the 95% confidence interval.

