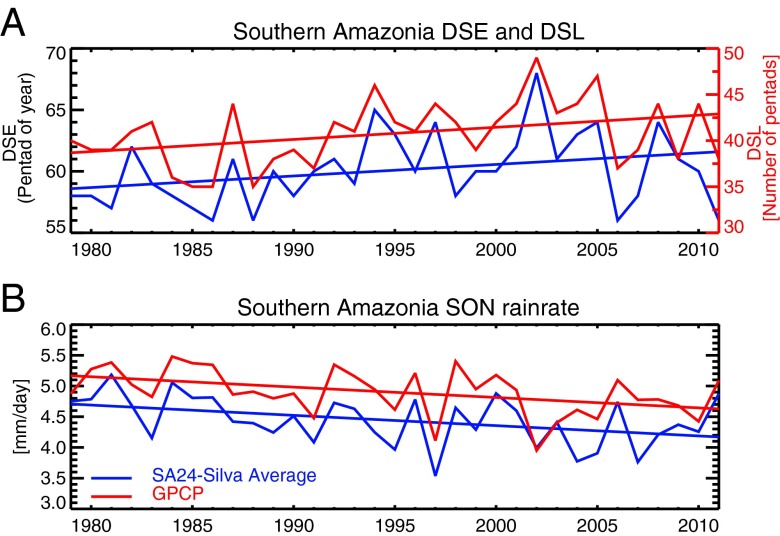
Fig. 1.
(A) Annual time series of the DSL (red line) and DSE (blue line) dates derived from the PM daily rainfall data over the southern Amazonian domain show a decrease of DSL due to a delay of DSE. The unit is pentad (5 d). On the left axis, the 55th pentad corresponds to September 2–7 of the calendar date and the 70th pentad corresponds to December 10–15. (B) Time series of austral spring seasonal rainfall over southern Amazonia derived from the PM and GPCP datasets show decrease of rainfall consistent with the delay of DSE shown in (A). The linear trend is determined by a least-square fitting. Trends are significant at P < 5% based on Santer et al. (24).

