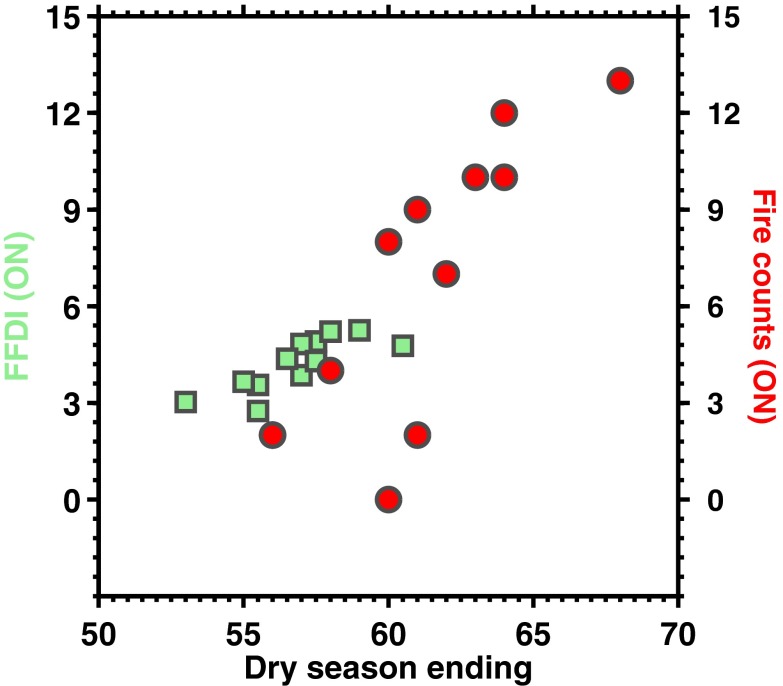
Fig. 2.
The DSE (unit is pentad) versus FFDI (green squares, units are nondimensional) and fire count (red circles, unit is number of pixels) in October and November for the period of 2000–2011 suggest prolonged fire season with delayed DSE. The 50th pentad corresponds to September 10–15 and the 70th pentad corresponds to December 10–15. The fire counts are derived from the moderate resolution imaging spectroradiometer fire-count data. FFDI is first derived from the ERA-Interim and NCEP reanalysis, respectively, and then averaged to obtain its values shown in the figure.

