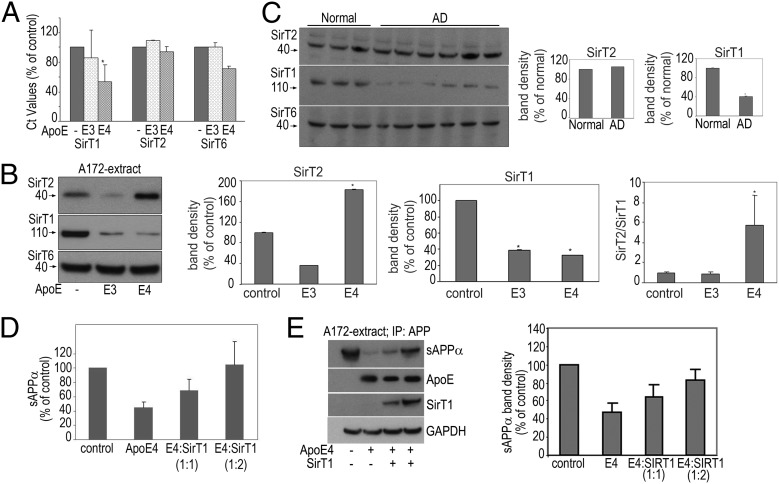
Fig. 4.
ApoE’s effects on Sirtuin expression in cells and AD postmortem tissue. Following transfection of A172 cells with ApoE isoforms, cell pellets were collected and used for RNA isolation and PCR or for SDS/PAGE and WB. (A) The real-time PCR cycling was performed as described in SI Materials and Methods. Data (δCt values expressed as percentage of untransfected control) are from three experiments performed in triplicate, *P < 0.05. (B) Cell extracts were subjected to SDS/PAGE and WB to detect SirT1, T2, and T6. Band densities are expressed as a percentage of untransfected control. Data (mean ± SE) are from three independent experiments,*P < 0.05. (C) Representative immunoblots probed for SirT1, T2, and T6 from homogenates of the temporoparietal region of control subjects and AD patients. Band densities are expressed as a percentage of normal human brains. (D and E) Overexpression of SirT1 reverses ApoE4-mediated reduction in sAPPα. Following transfection of A172 cells with ApoE4 and SirT1 (1:1 and 1:2, respectively), sAPPα secreted into the medium (D) was assayed as mentioned in SI Materials and Methods. Cell extracts were subjected to IP with an N-terminal anti-APP antibody followed by SDS/PAGE and WB to detect sAPPα (E). The last three panels represent ApoE, SirT1, and GAPDH (loading control) before the pull-down. Band densities of sAPPα are expressed as a percentage of sAPPα in control untransfected cells.

