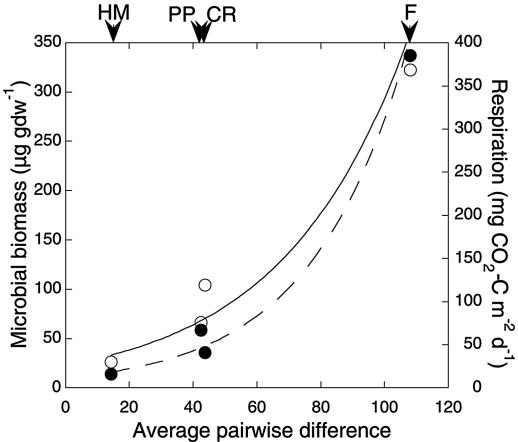
FIG. 5.
Exponential relationship for microbial biomass (r = 0.99) (○) and respiration (r = 0.99) (•) with average pairwise difference within clone libraries (Table 1); library abbreviations are as defined in the legend to Fig. 2. Biomass and respiration data are taken from a report by King (18). Arrows indicate average pairwise differences for each library.

