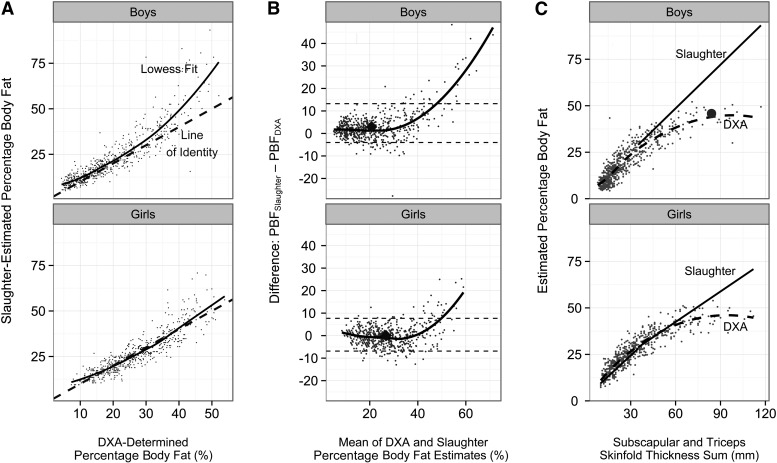
FIGURE 1.
Values are based on the 626 boys and 570 girls in the Pediatric Rosetta Body Composition Project. A: Relation of DXA-determined PBF (PBFDXA) with PBF calculated from the Slaughter equations (PBFSlaughter). Data points represent the individual children, the dashed line is the line of identity (PBFDXA = PBFSlaughter), and the solid line is the smoothed (Lowess) curve. B: Bland-Altman plot for the agreement between PBFDXA and PBFSlaughter. Data points represent the individual children, and the black line is the Lowess curve. Overall medians are represented by the large diamonds, and the dashed lines represent the 95% CIs for the agreement between the 2 methods. C: Relation of SF sum to percentage body fat. Based on the Slaughter equations, all estimates of PBF for children with an SF sum ≥35 mm would fall on straight lines, with slopes of 0.783 (boys) and 0.546 (girls). The data points represent the DXA-calculated body fatness of each child, and the dashed lines represent the Lowess-estimated association between SF sum and PBFDXA. Among boys, the discrepancies between PBFDXA and PBFSlaughter increase substantially at higher SF sum levels. The large circle represents a boy with an SF sum of 84 mm (first row of Table 3). DXA, dual-energy X-ray absorptiometry; Lowess, locally weighted scatter plot smoothing; PBF, percentage body fat; PBFDXA, percentage body fat estimated by using dual-energy X-ray absorptiometry; PBFSlaughter, percentage body fat estimated by using the Slaughter skinfold-thickness equations; SF sum, sum of subscapular and triceps skinfold thicknesses.

