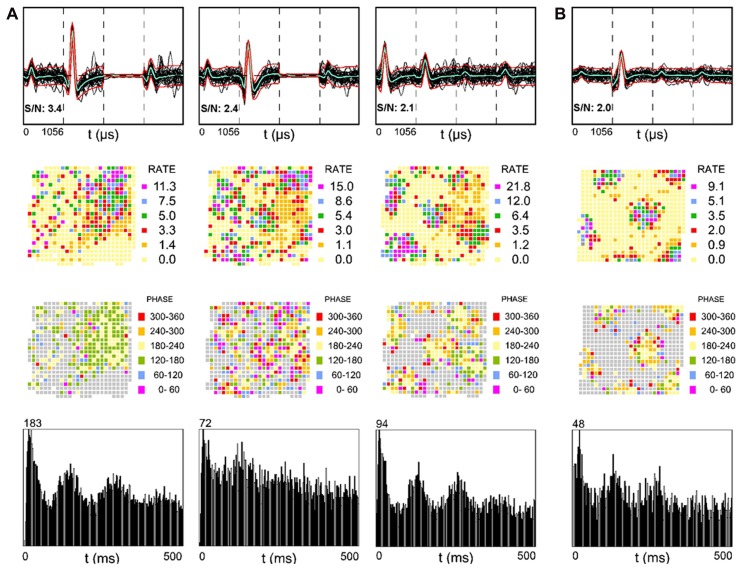
FIGURE 2.
Examples of SDWs recorded from the alveus in the absence of somatic activity compared across each wire of a tetrode (top row) and its corresponding firing rate map (second row), phase map (third row), and autocorrelogram (fourth row). The three examples on the left were simultaneously recorded from one rat (A) while the example on the far right was recorded from a different rat (B). The overlay of 60 spikes as well as the average waveform for each SDW is displayed for each wire (top row). The third channel in each of the two examples on the far left is flat, denoting a malfunctioning electrode channel. recording channel. The discharges of several of the SDWs shown are indicative of grid patterns (second row) and appear to be organized by local theta oscillations (third row) as spike activity advances from late to early phases of the theta cycle as the animal passes through each grid vertex. Averaged across the entire 16 min session, the spiking of the SDWs on entry into the periphery of each field tends to occur on one phase, while the firing in the central part of each field tends to be earlier by about 180°. The firing pattern the first putative axon in 5a resembles a place field but is phase locked between 120 and 240°. The bottom row shows the autocorrelation for each putative axon and is indicative of significant theta modulation in their firing activity.

