
Figure 1.
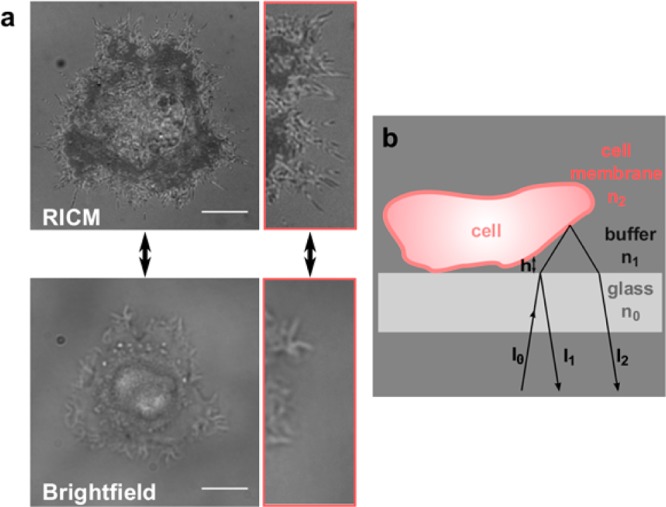
(a) RICM image (top) and bright-field image (bottom) of a cell. The different gray levels in the adhesion topology image correlate with the amount of distance between the cell membrane and the glass interface (dark area = close contact area). In addition, small cell filopodia that are invisible in bright-field images can be visualized with RICM. Scale bar: 10 μm. (b) Scheme of RICM image formation at the cell surface interface. I1 and I2 are the intensities of the light reflected on the glass–buffer and the buffer–cell interface. The interference between these rays is measured.