
Figure 2.
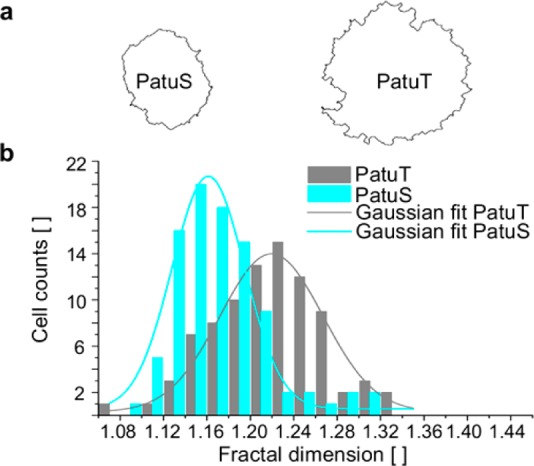
(a) Boundary images of two representative PatuS and PatuT cells. In b, the histograms of the fractal dimension for both cell lines are shown. The data could be fitted with a Gaussian curve. The FD of PatuT cells is significantly (p < 0.001) higher than the FD of PatuS cells (NPatuT = 86, NPatuS = 93 cells).