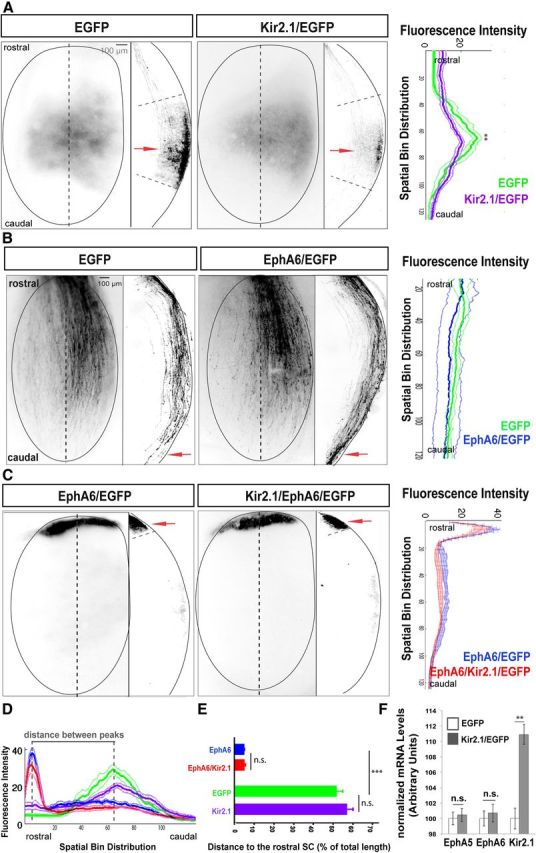
Figure 4.

Spontaneous activity is not necessary to transduce EphA/ephrinA signals during the establishment of the rostrocaudal visual map. A, Representative examples of the SC of P9 mice electroporated at E13 with the indicated plasmids. Top views of the SCs and sagittal sections through the SC at the level indicated by the dotted line are shown. Red arrows point to the most intense fluorescence area in each case. Graphs represent fluorescence intensity (mean ± SEM) from three consecutive sections of P9 electroporated mice (seven mice were used to measure fluorescence intensity in each condition). No significant differences between both graphs were observed in the distance of the TZ (peak of fluorescence) to the rostral SC (p = 0.02), although the termini distribution at the TZ of Kir2.1/EGFP-expressing mice was wider than that of controls (p = 0.0004). B, Representative example of P0 SCs electroporated at E13 with EphA6/EGFP or EGFP alone plasmids. Top views of the SC and sagittal sections through the SC at the level indicated by the dotted line are shown. Red arrows indicate the termination of the majority of targeted axons. Graphs represent the mean ± SEM fluorescence intensity from three consecutive sections of the SCs of electroporated mice (five mice were used to measure fluorescence intensity in each condition). The graphs show no significant differences in behavior among the axons electroporated with EphA6/EGFP or EGFP alone (one-way ANOVA). C, Representative examples of the SC of P9 mice electroporated at E13 with the indicated plasmids. Top views of the SCs and sagittal sections through the SC at the level indicated by the dotted line are shown. Red arrows point to the most intense fluorescence area in each case. Graphs represent fluorescence intensity (mean ± SEM) from three consecutive sections of P9 electroporated mice (seven mice were used to measure fluorescence intensity in each condition). No significant differences were observed between both graphs. D, Overlay demonstrates that fluorescence intensity peaks from samples expressing either EGFP or Kir2.1/EGFP and samples expressing either EphA6 or EphA6/Kir2.1 are very distant. E, Distance of RGC axons electroporated with the indicated plasmids to the most rostral point of the SC. Units are the percentage of the total collicular length once individual sections were conformed to a SC template. Values are plotted as the mean ± SEM. ***p < 0.001, Student's unpaired t test. n.s., Not significant. F, Graphs show mRNA levels for EphA5 and EphA6 in E16 retinas of embryos electroporated at E13 with EGFP alone or with Kir2.1/EGFP plasmids. Ten retinas/condition were pooled per experiment. The average of four experiments is shown. Values are plotted as the mean ± SEM. **p < 0.01, Student's unpaired t test.
