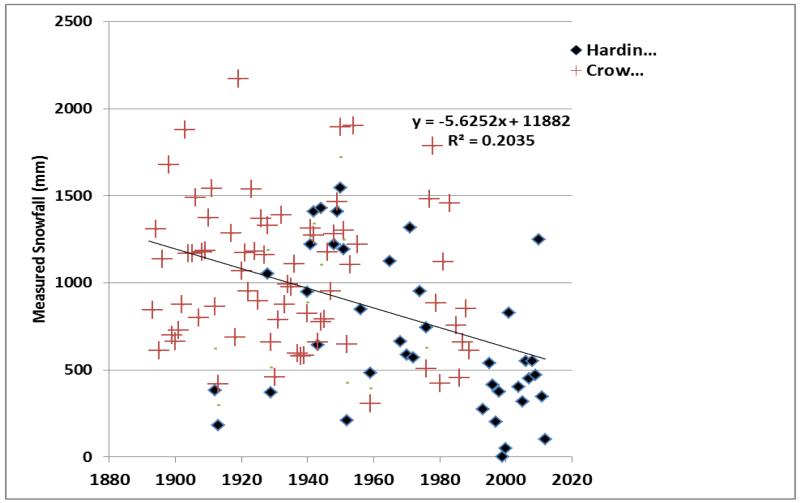
Figure IV.
Plot showing annual snowfall in millimeters from Hardin MT (1912-2012) and Crow Agency MT (1895-1990) observation sites, calculated in water years. The trendline is calculated from the average of measurements when both locations had measurements, and on the single site’s measurements when only one station was operating. Years with more than one month of missing data were deleted from data plot, except for the earliest records. (Data source: National Climate Data Center.)

