Figure 2.


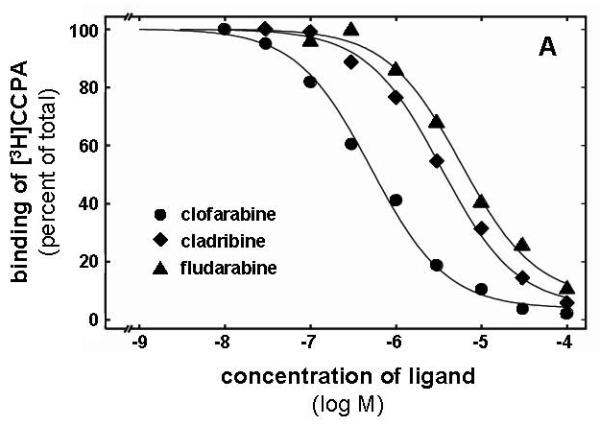
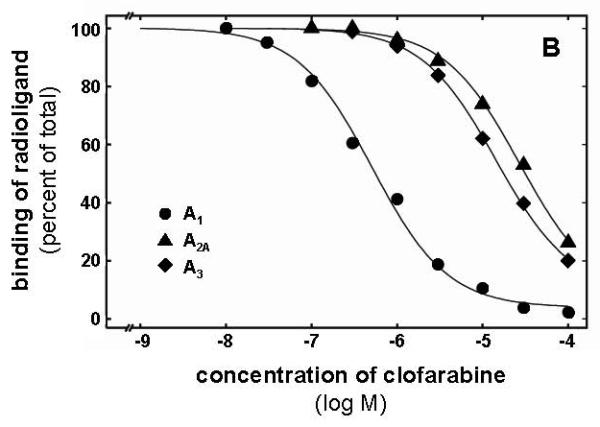
Radioligand competition experiments with clofarabine, cladribine and fludarabine. The curves in A represent competition for [3H]CCPA binding to A1 adenosine receptors with clofarabine showing the highest affinity (Ki 248 nM), followed by cladribine (Ki 1,643 nM) and fludarabine (Ki 2,238 nM). In B competition binding of clofarabine to A1, A2A, and A3 receptors using [3H]CCPA, [3H]NECA, and [3H]HEMADO as radioligands, respectively (corresponding Ki values are: 248 nM, 17,500 nM, and 8,280 nM. The shown curves are from single experiments, for data in detail see Table 1.
