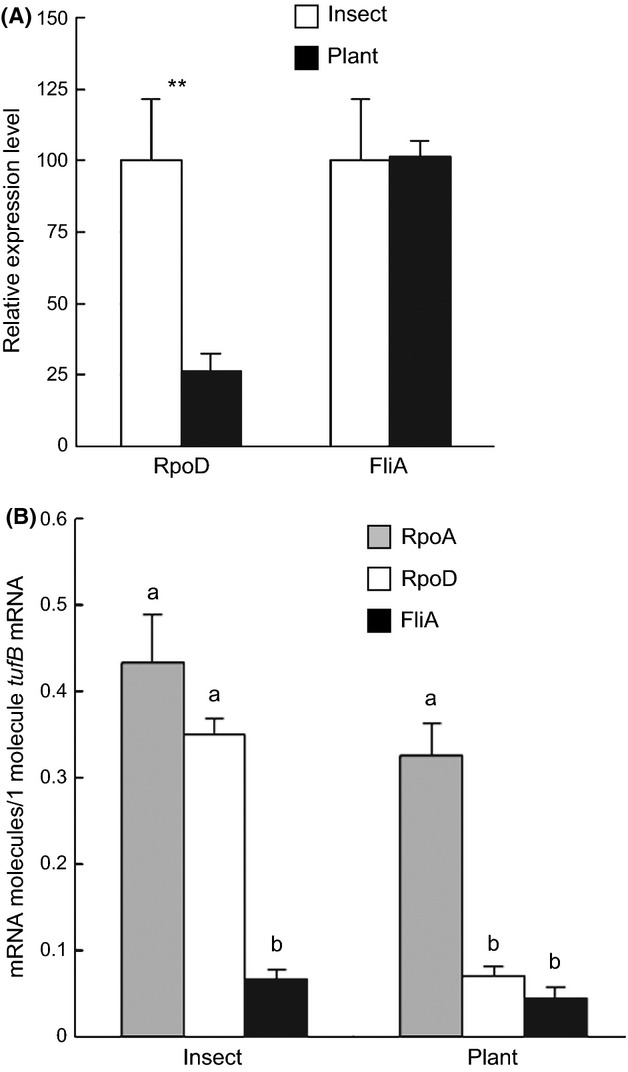
Figure 1.

Transcriptional expression levels of OY-M-derived rpoD, fliA, and rpoA in insect and plant hosts. (A) Relative quantification of rpoD and fliAmRNAs in insect and plant hosts. Transcription of rpoD and fliAmRNAs was examined by qRT-PCR and the results were normalized against tufB expression. The expression level of the σ factors in insect host were adjusted to 100%. Error bars indicate SE. **A significant difference of P < 0.01 (Student's t-test). Note that differences in the expression level between RpoD and FliA could not be compared because the quantitative values are relative. (B) Absolute quantification of rpoA, rpoD, and fliAmRNAs. The numbers of rpoA, rpoD, and fliAmRNA molecules were examined by absolute qRT-PCR and the results were normalized against the number of tufBmRNA molecules. Error bars indicate SE. “a” and “b” are significantly different at the 5% level by Scheffe's test. Note that all six expression levels are compared.
