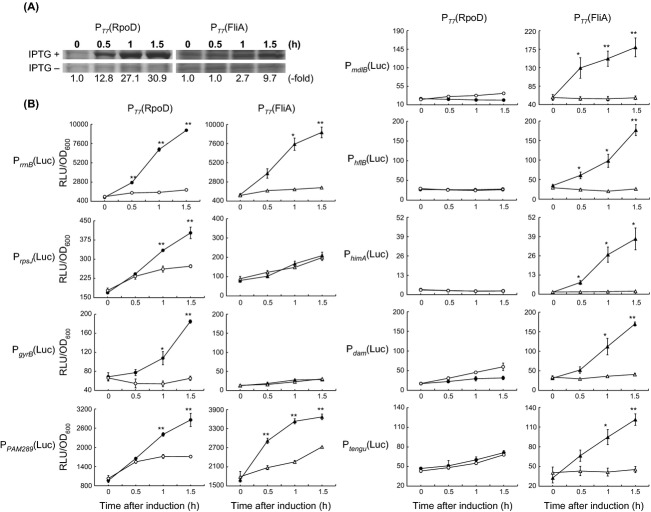
Figure 5.
The Escherichia coli-based ex vivo reporter assay system using luciferase. (A) RpoD and FliA expression levels. RpoD and FliA protein levels in E. coli cells were analyzed by SDS-PAGE with or without IPTG treatment. Protein extracted from equivalent cell numbers were loaded onto each lane representing each experimental time point (0–1.5 h). Below each lane, the “-fold” numbers represent protein band density from each IPTG+ lane subtracted by the density calculated from the respective IPTG- lane, and then normalized to the density value at 0 h. (B) Luciferase activity measurements of σ factors regulating different promoters. Relative light unit (RLU) values indicate the magnitude of luciferase activity. RLU readings were normalized according to cell density (OD600). Closed and open symbols (circle and triangle) indicate treatment with or without IPTG, respectively. Error bars indicate SE. * and **Statistically significant differences at P < 0.05 and P < 0.01, respectively (Student's t-test).

