Figure 3.

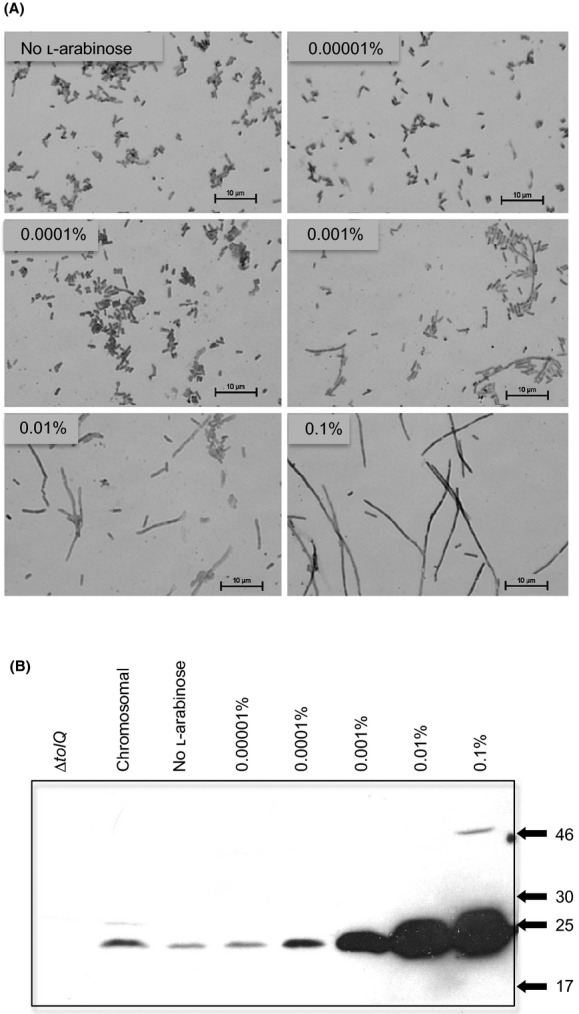
The extent of cell filamentation corresponds to TolQ expression levels. Figure 3A: Stained preparations of W3110 bearing a plasmid carrying the tolQ gene under the control of the pBAD promoter grown for 24 h at 37°C with aeration in Miller LB supplemented with 100 μg mL−1 ampicillin and either 0.0% or 10-fold increments of l-arabinose are shown. All panels are displayed at the same relative magnification, with a bar representing 10 μm provided in each panel for scale. Figure 3B: Immunoblot analysis of samples from cells grown to exponential phase in Miller LB supplemented with 100 μg mL−1 ampicillin and either 0.1% (w/v) l-arabinose for W3110 carrying the control plasmid pBAD24 (“chromosomal” and “∆tolQ”, respectively) or as indicated for W3110 carrying a pBAD24 derivative bearing the tolQ gene under l-arabinose control. Samples were resolved by sodium dodecyl sulfate polyacrylamide gel electrophoresis (SDS-PAGE) on an 11% polyacrylamide gel, transferred to a PVDF membrane and visualized by enhanced chemiluminescence using a monospecific anti-TolQ antiserum as described in Methods. The positions of molecular mass standards are indicated as kDa values at the right side of the developed blot. At higher levels of induction an additional, minor species of greater apparent molecular mass is detected by the anti-TolQ antiserum (0.1% lane).
