Figure 6.

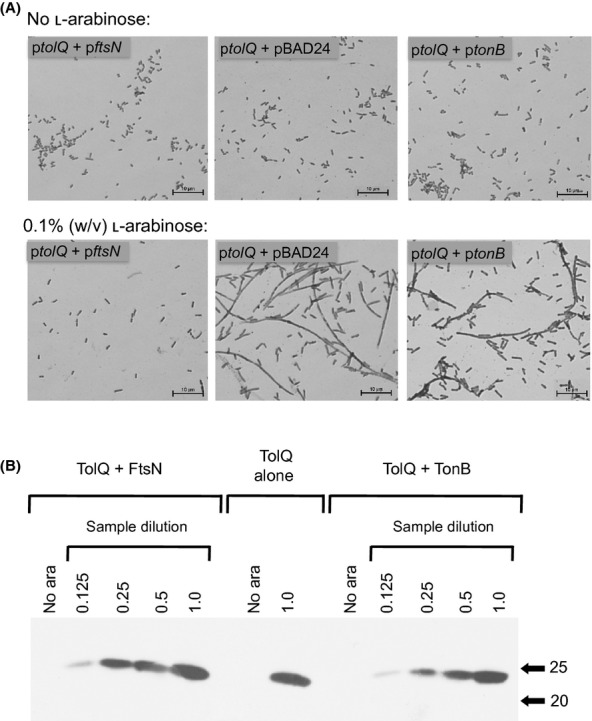
Overexpression of FtsN suppresses TolQ-induced cell filamentation. Figure 6A: Stained preparations of W3110 cells bearing a chloramphenicol-selected plasmid carrying the tolQ gene under the control of the pBAD promoter and paired with either an ampicillin-selected control plasmid (ptolQ + pBAD24), with a pBAD24 derivative carrying ftsN under the control of the pBAD promoter (ptolQ + pftsN) or with a pBAD24 derivative carrying tonB under the control of the pBAD promoter (ptolQ + ptonB) grown for 24 h at 37°C with aeration in Miller LB supplemented with 100 μg mL−1 ampicillin and 34 μg mL−1 chloramphenicol are shown. Cultures were either not supplemented with l-arabinose or were supplemented with 0.1% (w/v) l-arabinose. Figure 6B: Immunoblot analysis of samples taken of the above cells at 24 h culture. A serial twofold dilution series was made for samples from cells coexpressing TolQ and either FtsN or TonB to allow for comparison of relative levels of TolQ protein, with “1.0” representing the undiluted sample and the other values representing the relative fraction thereof loaded onto the gel. Samples expressing TolQ alone and samples from cultures not supplemented with l-arabinose were loaded onto the gel without dilution. Samples were resolved by SDS-PAGE on an 11% polyacrylamide gel, transferred to a PVDF membrane and visualized by enhanced chemiluminescence using a monospecific anti-TolQ antiserum as described in Methods. The positions of molecular mass standards are indicated as kDa values at the right side of the developed blot.
