
Figure 3.
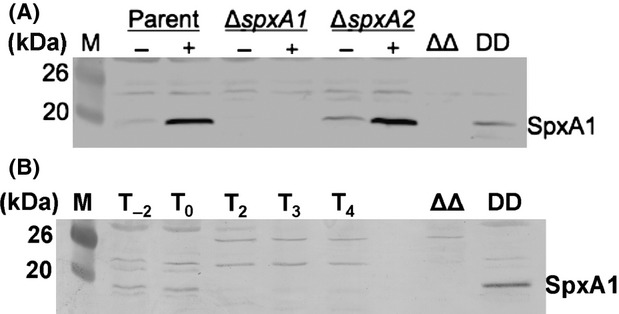
Protein levels of SpxA1 measured by Western blot. (A) SpxA1 levels in cultures grown with and without 1 mmol/L diamide (25 μg total protein applied; ΔΔ, ΔspxA1 ΔspxA2 (ORB8285); DD, Pspank(hy)-spxA1DD (ORB7863) +IPTG 45 min.). (B) Expression profile of SpxA1 during the B. anthracis vegetative life cycle (30 μg total protein loaded; Lanes: T−2 through T4, hours during vegetative growth; T0, transition to stationary phase; ΔΔ, ΔspxA1 ΔspxA2 [ORB8285]; DD, Pspank(hy)-spxA1DD [ORB7863] +IPTG 45 min.). Representative gels are shown in (A) or (B), each experiment was done twice. Growth conditions for obtaining cells for whole cell extracts are presented in Experimental Procedures.