
Figure 4.
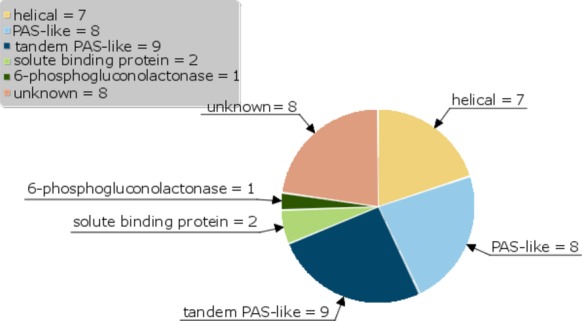
A Pie chart representation of the tertiary folds predicted (results from Table 1) for the periplasmic sensor domains of A. dehalogenans 2CP-C.
Official websites use .gov
A
.gov website belongs to an official
government organization in the United States.
Secure .gov websites use HTTPS
A lock (
) or https:// means you've safely
connected to the .gov website. Share sensitive
information only on official, secure websites.
A Pie chart representation of the tertiary folds predicted (results from Table 1) for the periplasmic sensor domains of A. dehalogenans 2CP-C.