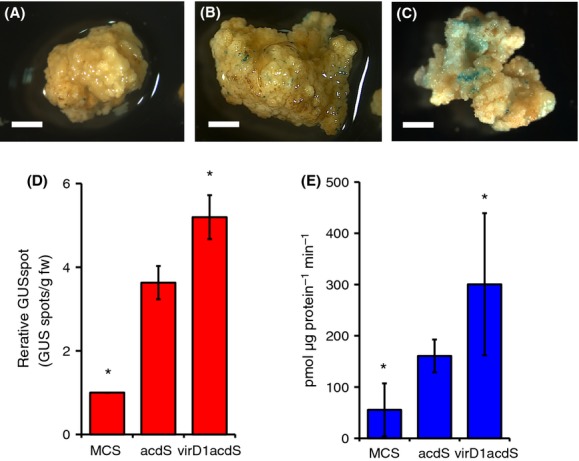
Figure 4.

T-DNA delivery efficiency in E. ravennae. GUS-stained calli inoculated with A. tumefaciens (pBBRMCS1-5, pEKH2) (A), A. tumefaciens (pBBRacdS, pEKH2) (B), and A. tumefaciens (pviracdS, pEKH2) (C). Blue spots indicate transformed cells. The bar indicates 5 mm. (D) Occurrence of T-DNA transformation in E. ravennae. This graph shows the relative number of GUS spots. The number of GUS-stained spots per 1 g of E. ravennae calli was counted for each treatment. The bars indicate the standard deviation (n = 3). Asterisks indicate values that were significantly different from A. tumefaciens (pEKH2, pBBRacdS) inoculation according to the Student's T-test (P < 0.05). (E) Estimation of the transformation efficiency using the fluorometric GUS assay. GUS activity was measured immediately after cocultivation. The mean GUS activity ± SD was calculated from the results of three experiments. Approximately 2 g of E. ravennae calli was used in each experiment. Asterisks indicate statistically significant differences according to Student's T-test (P < 0.05). MCS: A. tumefaciens GV2260 (pBBRMCS1-5, pEKH2); acdS: A. tumefaciens GV2260 (pBBRacdS, pEKH2); virD1acdS: A. tumefaciens GV2260 (pvirD1acdS, pEKH2).
