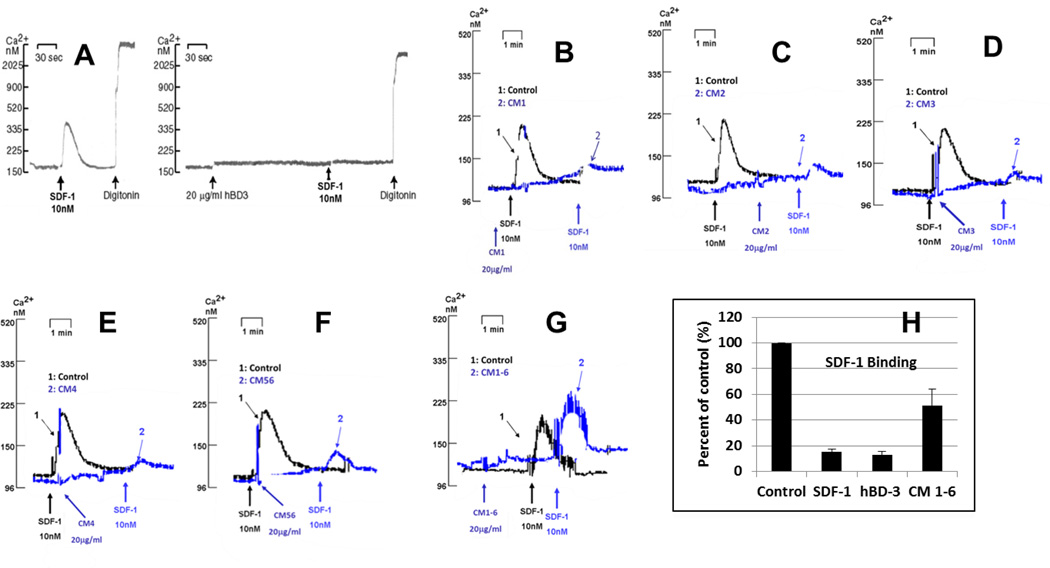
Figure 3. Effect of Cys mutations on the activity of hBD-3.
Panels A through H show the ability of hBD-3 and its mutants to inhibit SDF-1α-dependent Ca2+ mobilization. A: wild type (wt); B: mutant CM1 (C11S-hBD3); C: mutant CM2 (C18S-hBD3); D: mutant CM3 (C23G-hBD3); E: mutant CM4 (C33I-hBD3); F: mutant CM56 (C40G/C41Y-hBD3); G: CM1–6 (C11S/C18S/C23G/C31I/C40G/C41Y-hBD3); H: inhibition of SDF-1α binding by CM1–6. For Ca2+ mobilization assays (panels A through G), 1 (black) or 2 (colored, blue here) indicate control or experimental (pretreated with wt hBD-3 or mutants) fura2 fluorescence traces respectively; arrows beneath the fluorescence traces indicate the time when respective reagents were added with, black for control, colored for experimental groups. Similar labeling was used for the fura2 fluorescence traces in all subsequent figures.

