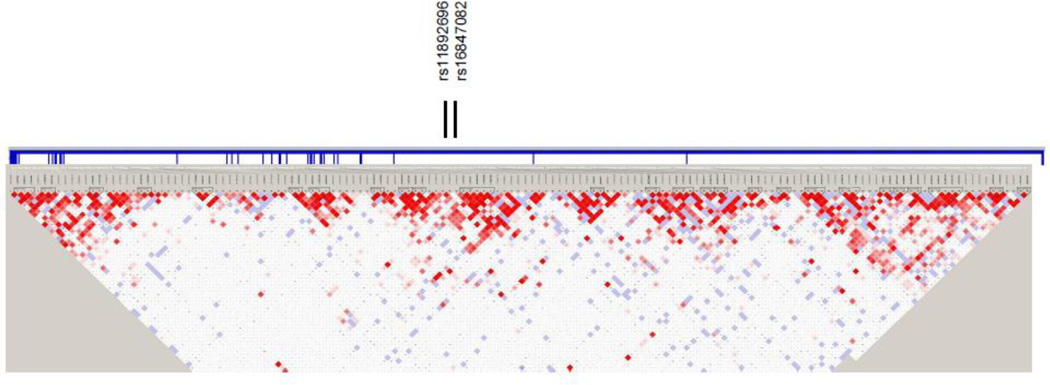
Figure 2.
Haploview linkage disequilibrium (LD) structure map of SNPs genotyped within ERBB4. The 2 SNPs that reached significance level of P<0.05 in the combined replication set are marked above the map. ERBB4 exons are denoted by thick vertical lines between the SNPs and map. Depth of shading in the map represents D´ values (dark=high inter-SNP D´ white=low inter-SNP D´). Pairwise correlation structure analyzed by Haploview software (Haploview: http://www.broadinstitute.org/haploview/haploview)

