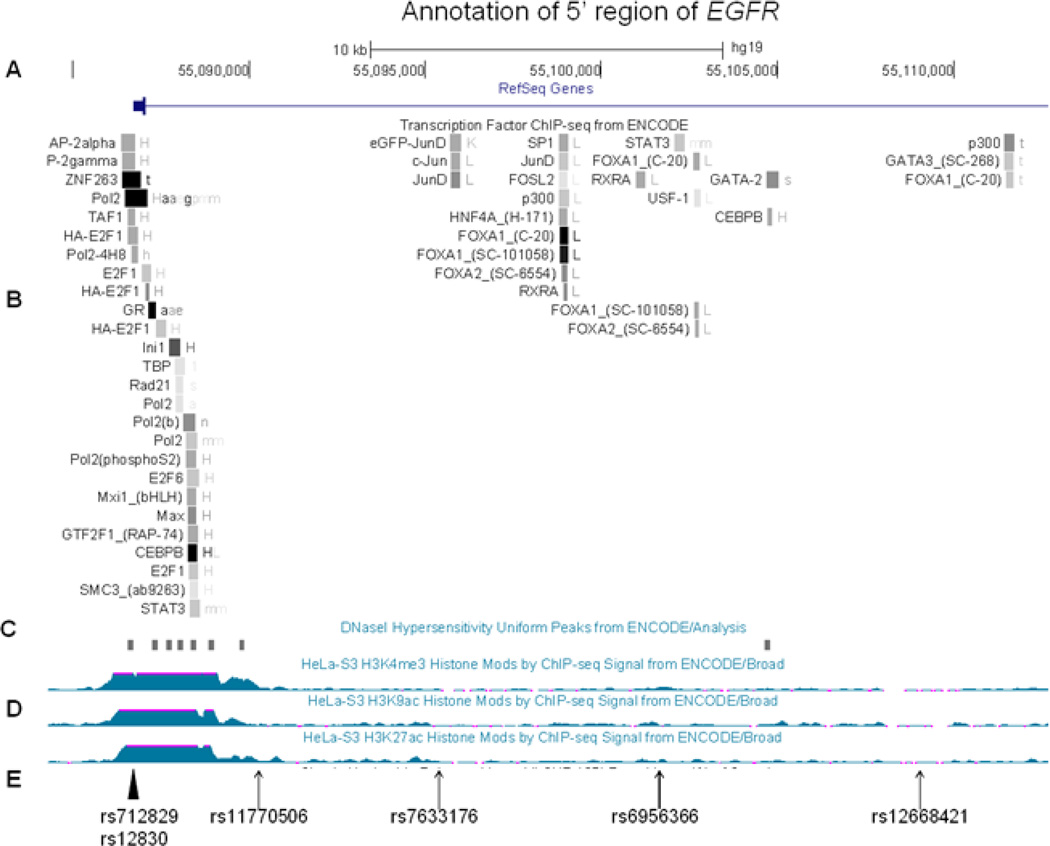
Figure 3.
Structure of the 5’ region of EGFR using the aligned annotate tracks from the Human Genome Browser (CRCh37/gh19) (http://genome.ucsc.edu/cgi-bin/hgGateway). A. Genome scale, nucleotide position and 5´EGFR. B. Transcription Factor ChIP-seq data from ENCODE-shaded squares show DNA regions where transcription factors bind as assayed by chromatin immunoprecipitation with antibodies specific to the transcription factor followed by sequencing of the precipitated DNA (ChIP-seq) C. DNaseI Hypersentivity Peaks from ENCODE-shaded squares show areas of open chromatin that defines segments of DNA that are unpacked and accessible to the regulatory factors, enzymes, and smaller molecules in the cell, D. Histone modification by ChIP-seq signal from Encode, E. The significant SNPs identified in this study are indicated by an arrow and two previously reported SNPs altering EGFR function are indicated by an arrowhead.

