
Figure 5.
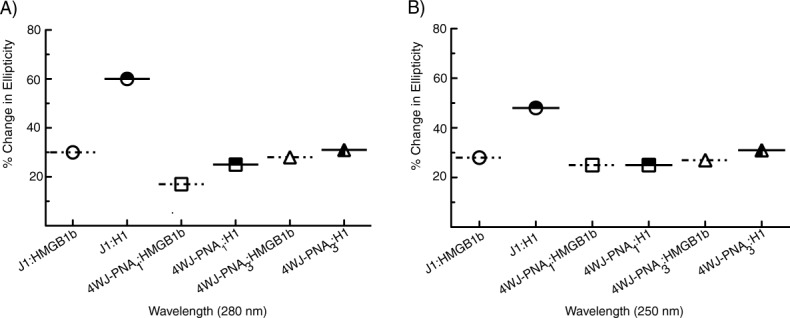
Maximum change in molar ellipticity of each 4WJ in the presence of HMGB1b (open icons) and histone H1 (hatched icons). Panel (A) 280 nm and (B) 250 nm. The data is based on the measurements displayed in Figure 4.
Official websites use .gov
A
.gov website belongs to an official
government organization in the United States.
Secure .gov websites use HTTPS
A lock (
) or https:// means you've safely
connected to the .gov website. Share sensitive
information only on official, secure websites.
Maximum change in molar ellipticity of each 4WJ in the presence of HMGB1b (open icons) and histone H1 (hatched icons). Panel (A) 280 nm and (B) 250 nm. The data is based on the measurements displayed in Figure 4.