
Figure 6.
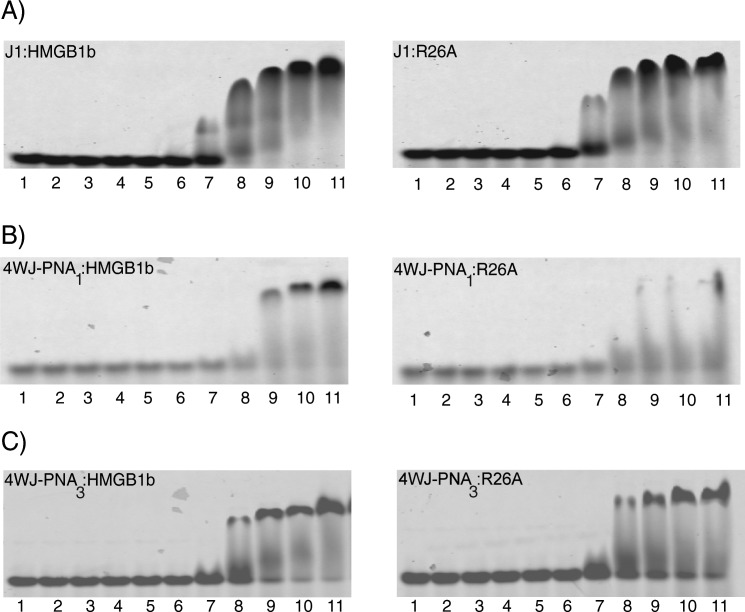
Electrophoretic mobility shift analysis of each 4WJ in the presence of HMGB1b and R26A. Panel (A) corresponds J1 analysis, (B) 4WJ-PNA1, and (C) 4WJ-PNA3 analysis. Lane 1, 4WJ (0.05 µM); lanes 2–11 represent each 4WJ incubated with each protein at protein/DNA ratios of 1:1, 2:1, 4:1, 8:1, 16:1, 32:1, 64:1, 128:1, 256:1, and 478:1.