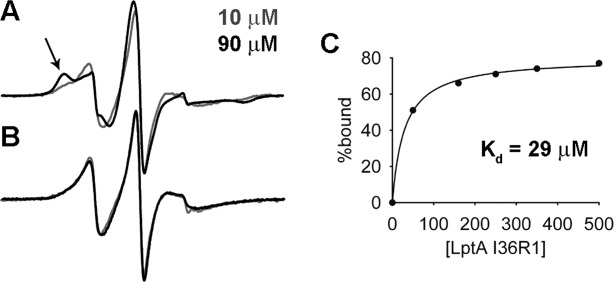
Figure 2.

Overlays of EPR spectra of 10 µM (gray) and 90 µM (black) I36R1 LptA in the (A) WT and (B) Q148A/K149A backgrounds. Arrow indicates the immobile component that arises due to oligomerization of WT LptA at the interface containing I36R1. The lack of motional change in the Q148A/K149A LptA mutant indicates the protein does not oligomerize at the N-terminal interface. (C) Plot of the datapoints generated from the deconvolution of the EPR spectra analyzed and fit to a one-site binding model.
