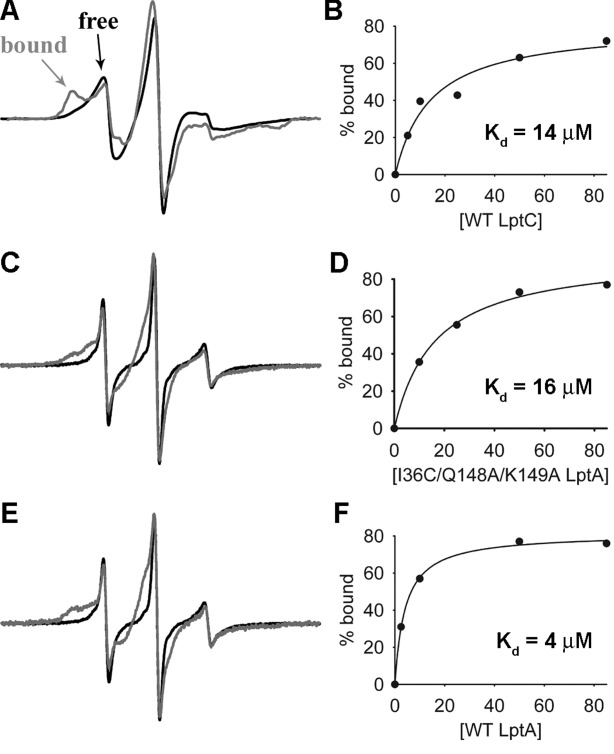
Figure 5.

EPR binding assays. (A) 10 µM I36R1/Q148A/K149A LptA apo (black) and in the presence of 85 µM WT LptC (gray). The bound and unbound (free) fractions are labeled to highlight the spectral changes that occur upon protein binding. (C) 10 µM Y182R1 LptC apo (black) and in the presence of 85 µM I36C/Q148A/K149A LptA (gray). (E) 10 µM Y182R1 LptC apo (black) and in the presence of 85 µM WT LptA (gray). (B, D, F) Plots of the data points generated from the deconvolution of the EPR spectra fit to single site binding curves in SigmaPlot are shown next to each corresponding example overlay.
