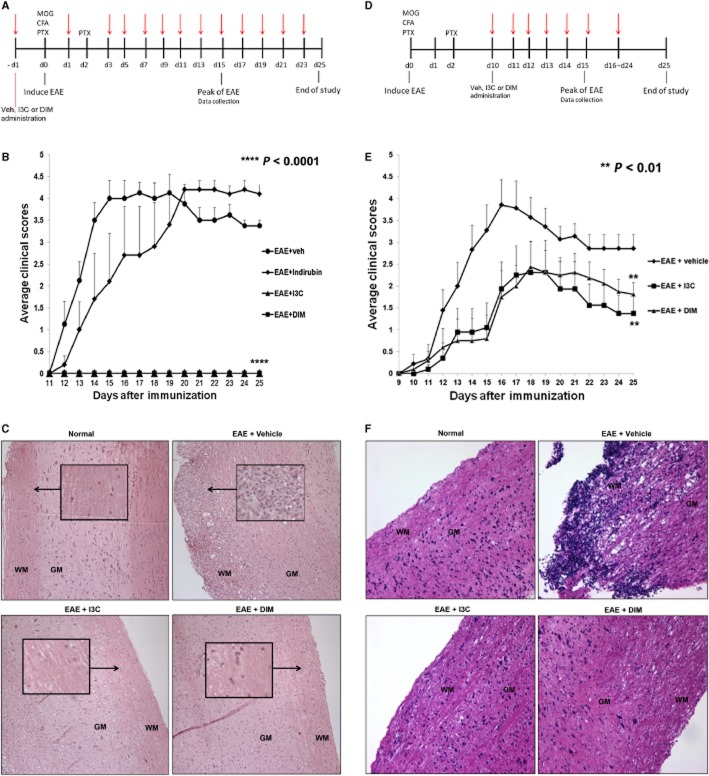
Figure 1.
Effect of treatment with I3C or DIM on the development of EAE in C57BL/6 mice. (A) Timeline schematic of studies involving EAE mice pretreated with vehicle, indirubin, I3C or DIM. Treatment was administered at time points indicated in red arrows. (B) Clinical scores (n = 10 per group) for EAE mice pretreated with vehicle, indirubin, I3C or DIM. (****, P < 0.0001; EAE + I3C or EAE + DIM vs. EAE + vehicle, Mann–Whitney test) (C) Representative images of spinal cord histopathology stained with H&E (10×) at Day 15 for pretreatment studies. Arrows indicate regions of cellular infiltration. Architecture is noted as white matter (WM) and grey matter (GM). (D) Timeline schematic of studies involving EAE mice post-treated with vehicle, I3C or DIM. Treatment was administered at time points indicated in red arrows. (E) Clinical scores (n = 10 per group) for EAE mice post-treated with vehicle, I3C or DIM. (**, P < 0.01; EAE + I3C or EAE + DIM vs. EAE + vehicle, Mann–Whitney test) (F) Representative images of spinal cord histopathology stained with H&E (10×) at Day 15 for post-treatment studies. Architecture is noted as white matter (WM) and grey matter (GM).

