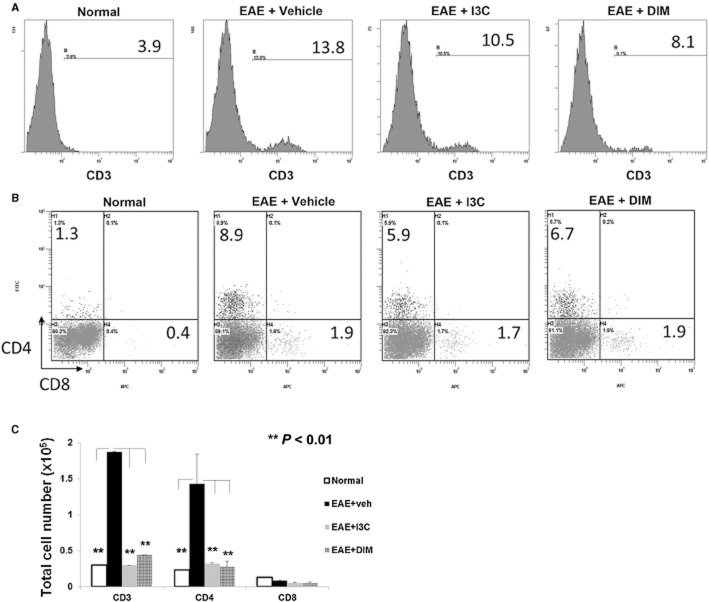
Figure 3.
Post-treatment with indoles reduces T cell infiltration within brain tissue of EAE mice. Mononuclear cells were isolated from brain tissue on Day 15 from EAE mice given vehicle, I3C or DIM. The cells were stained with various mAbs, analysed using flow cytometry and representative histograms depicted. (A) Single stained CD3 T cells; (B) double-stained for CD4 and CD8. (C) By calculating the percentage of T cell subsets determined by Flow cytometer multiplied by absolute number of cells found in the brain and divided by 100, gave the total cell number for CD3+, CD4+ and CD8+ T cells, which were then plotted (**P < 0.01; normal vs. EAE+vehicle; EAE+I3C or EAE+DIM vs. EAE+vehicle). Data presented as mean ± SEM of three pooled samples (n = 3 per sample).

