
Figure 7.
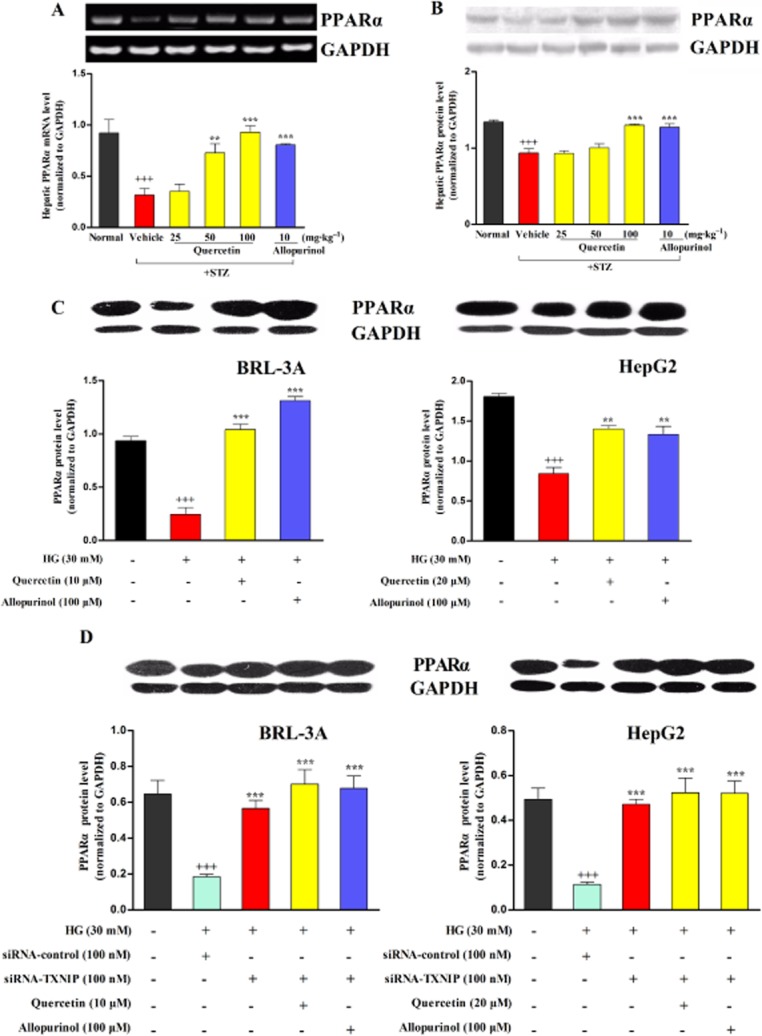
Quercetin and allopurinol up-regulate PPARα in STZ-induced diabetic rat liver and high glucose (HG)-exposed hepatocyte cells. Representative RT-PCR results and graphic presentation showed hepatic mRNA levels of PPARα (A) at week 7 after STZ injection in different groups of rats as indicated. Representative Western blot results and graphic presentation showed hepatic protein levels of PPARα (B) in different groups of rats as indicated. The data are expressed as the means ± SEM (n = 4). +++P < 0.001 versus normal control; **P < 0.01, ***P < 0.001 versus diabetic control. Hepatocyte cells BRL-3A and HepG2 were cultured with or without HG (30 mM) or quercetin and allopurinol in the presence or absence of siRNA TXNIP transfection for the indicated time, and then cellular lysate was used to measure PPARα by Western blot (C and D) (n = 4). The data are expressed as the means ± SEM. +++P < 0.001 versus control; **P < 0.01, ***P < 0.001 versus HG control. In siRNA TXNIP transfection experiments, the data are expressed as the means ± SEM. +++P < 0.001 versus control; ***P < 0.001 versus HG + control siRNA.