Fig. 4.

FTIR spectra of alginate and drug loaded nanoparticles.
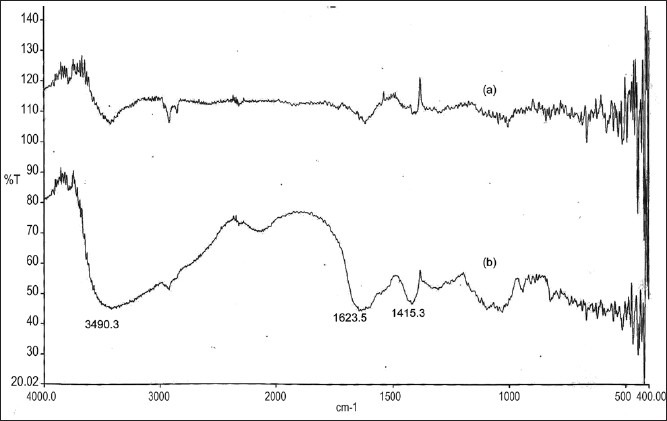
FTIR spectra of (a) alginate and (b) DT-loaded alginate nanoparticles (sodium alginate concentration 0.3, CaCl2 0.1% w/v and DT 2.5 mg/ml).

FTIR spectra of alginate and drug loaded nanoparticles.
FTIR spectra of (a) alginate and (b) DT-loaded alginate nanoparticles (sodium alginate concentration 0.3, CaCl2 0.1% w/v and DT 2.5 mg/ml).