
Figure 1.
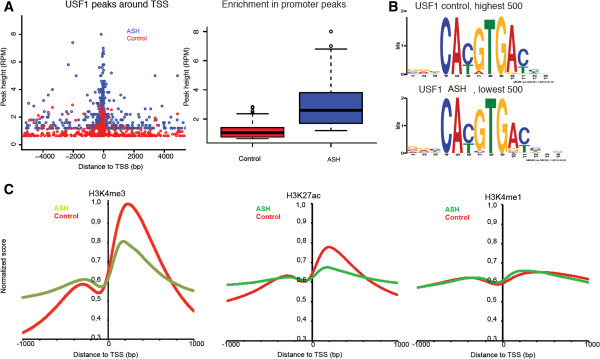
ChIP-seq peak distributions. A) Distribution and peak heights (left) of USF1 peaks around the TSS and the enrichment at promoters (right). Peak heights are reported in reads per million (RPM). B) The USF1 motif was identified in both high and low USF1 peaks. C) Foot prints in 2 kb windows of TSS for the Histone marks H3K4me1, H3K4me3, H3K27ac.