
Figure 4.
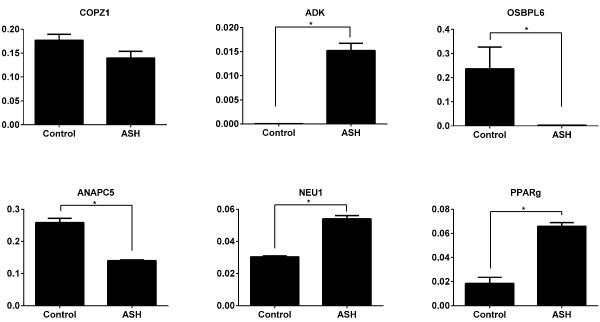
USF1-signal and mRNA expression. mRNA expression of the genes with differentially enriched USF1 peaks. Y-axis represents the relative expression after the normalization with GAPDH, Actin and RSP18. *P ≤ 0.05 considered as significant.
Official websites use .gov
A
.gov website belongs to an official
government organization in the United States.
Secure .gov websites use HTTPS
A lock (
) or https:// means you've safely
connected to the .gov website. Share sensitive
information only on official, secure websites.
USF1-signal and mRNA expression. mRNA expression of the genes with differentially enriched USF1 peaks. Y-axis represents the relative expression after the normalization with GAPDH, Actin and RSP18. *P ≤ 0.05 considered as significant.