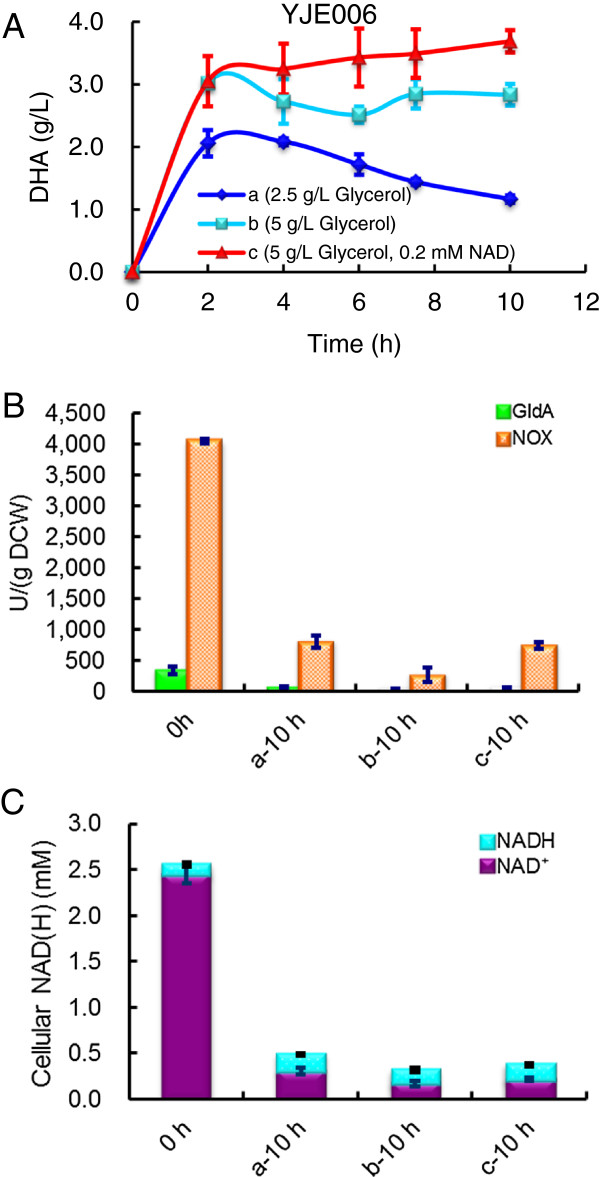
Figure 5.
DHA production by E. coli YJE006 whole cells in 20 mL of reaction buffer in 500-mL shake-flasks at 37°C, 200 rpm. (A) The time course of DHA formation; (B) Initial and end-point enzymatic activity of GldA and NOX; (C) Initial and end-point cellular NAD(H) level. The data represent the averages standard deviations for three independent samples. All data represent the averages ± SDs for three independent samples.

