
Figure 1.
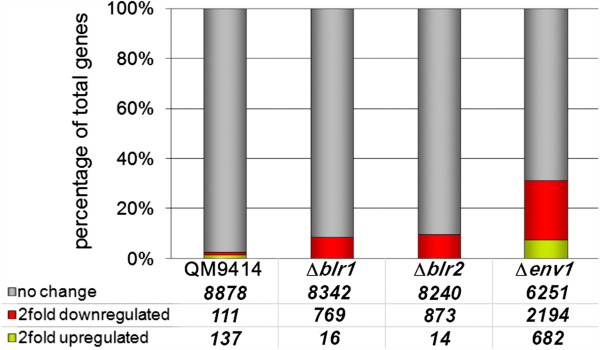
Comparison of light dependent differential regulation in wild-type, ∆env1, ∆blr1 and ∆blr2. Genes upregulated in light are represented by a green bar, those down-regulated are shown as red bar.
Official websites use .gov
A
.gov website belongs to an official
government organization in the United States.
Secure .gov websites use HTTPS
A lock (
) or https:// means you've safely
connected to the .gov website. Share sensitive
information only on official, secure websites.
Comparison of light dependent differential regulation in wild-type, ∆env1, ∆blr1 and ∆blr2. Genes upregulated in light are represented by a green bar, those down-regulated are shown as red bar.