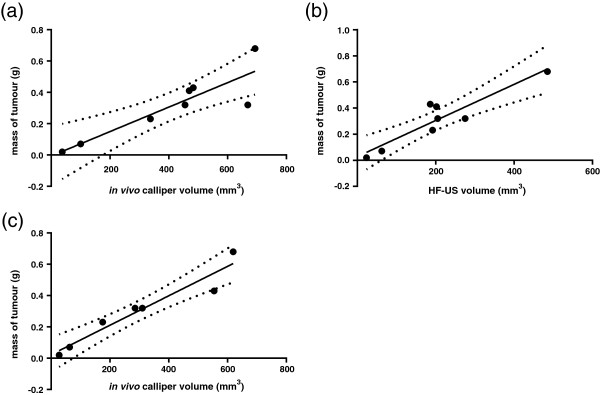
Figure 3.

Ex vivo callipers and HF-US correlated well to tumour mass. Final tumour mass correlated most strongly with ex vivo calliper volume. Pearson correlations showed that in vivo calliper volumes correlated the least with tumour mass (Figure 3a, R2 = 0.7843, 95% CI = 0.4811-0.9792, p = 0.0034), followed by HF-US volume (Figure 3b, R2 = 0.8470, 95% CI = 0.6135-0.9857, p = 0.0012) whereas ex vivo calliper volume showed the best correlation (Figure 3c, R2 = 0.9254, 95% CI = 0.7580-0.9946, p = 0.0005). Smaller tumours were not accurately weighed by the balance therefore n = 8.
