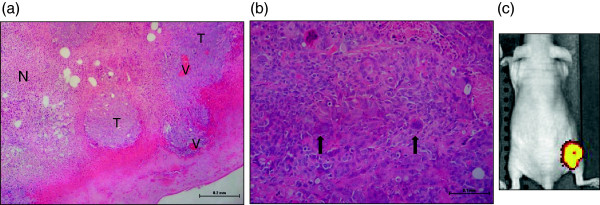
Figure 6.

Histological examination of the tumours. Haematoxylin and Eosin stained sections of xenografts. (a) Parental cell xenografts typically showed islands of viable tumour (T) containing blood vessels (V) with large areas of necrosis (N). (b) amplicon infected xenografts show syncitia (arrowed) present amongst the tumour cells, which were not observed in any of the parental cell line xenografts. (c) The IVIS Spectrum image clearly shows the fluorescence emission from the xenograft lobes in an amplicon-infected xenograft, pseudo-coloured with the software default settings of red to yellow for increasing intensity of signal (parental cell line xenografts contained no GFP and showed no signal by BFI).
