Figure 7.

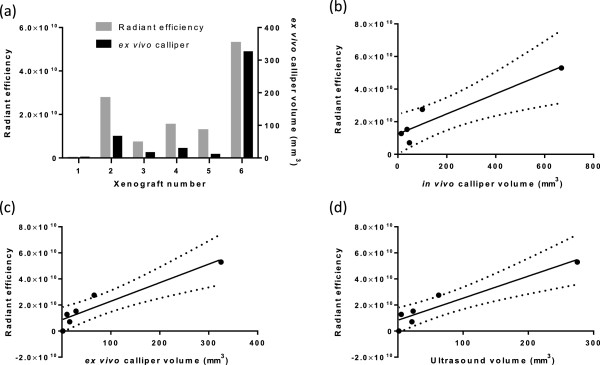
Total radiant efficiency correlates with xenograft tumour volume. (a) The total radiant efficiency of each amplicon-infected xenografts is plotted on the left y-axis of the graph alongside the ex vivo calliper tumour volume which is plotted on the right y-axis of the graph. Total radiant efficiency compared to in vivo calliper volume is shown (b), R2 = 0.8882, 95% CI = 0.3568-0.9963, p = 0.0164 (n = 5 as one xenograft was too small to be measured by callipers in vivo). Total radiant efficiency compared to ex vivo calliper volumes is shown in (c), R2 = 0.9417 95% CI = 0.5518-0.9938, p = 0.0050, n = 6. Total radiant efficiency compared to HF-US volumes is shown in (d), R2 = 0.8895, 95% CI = 0.5606-0.9939, p = 0.0048, n = 6.
