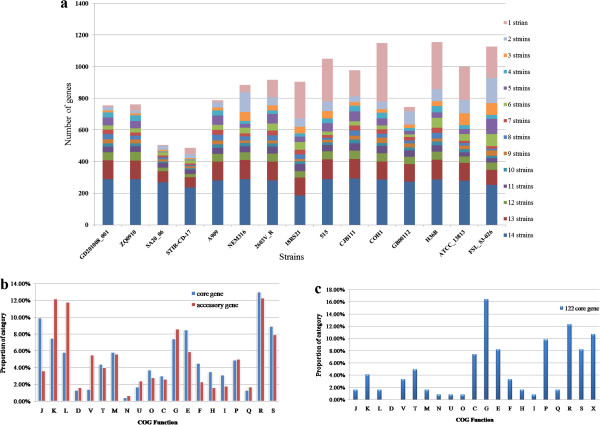
Figure 1.
The distribution of accessory gene number and genes functional classification of 15 Streptococcus agalactiae strains. (a) Number of conserved accessory genes in each strain. All noncore genes in each strain were classified into different levels of conservation according to the number of strains. Different conservations are presented by various colors. (b) Comparison of COG functional categories between core and accessory genes. The Y-axis indicates the percentage of genes in a particular functional category relative to the genes of all COG categories. Only assigned COG functional genes were taken into account. (c) COG functional categories of 122 core genes. From the analysis of the core genome, 122 core genes have been deleted or suffered loss of function in the ST260-553 fish strains. The Y-axis indicates the percentage of genes in a particular functional category relative to the genes of all COG categories. Unclassified COG functional genes were taken into account.

