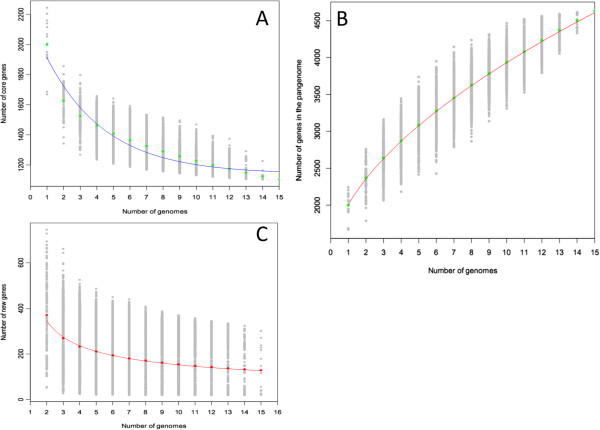
Figure 4.
Core and pan-genome calculations for 15 S. agalactiae strains. (A) S. agalactiae core genome. Each point represents the number of conserved genes between genomes. They are plotted as functions of strain number (x). For each x, circles are the 15!/[(x-1)!(15-x)] values from the different strain combinations. Squares are the averages of such values. The blue line represents the least-squares fit of the function C(x) = Ac x –tc + yc. The best fit was obtained with correlation r2 = 0.960 for Ac = 1021士80, tc = 0.28, yc = 1140士8. (B) S. agalactiae pan-genome. Numbers of genes are calculated for all possible combinations and plotted as a function of strain numbers (x). The red line demonstrates the exponential model based on the mean value of pan genes. The deduced pan-genome size P(x) = As*x^(ts) + ys. The best fit was obtained with correlation r2 = 0.999 for As = 726士2, ts = 0.562, ys = 1284士7. (C) Number of new predicted gene clusters identified by the sequencing additional genomes. The curve is fitted to the function S(x) = As*x^(ts)-As*(x-1)^(ts).

