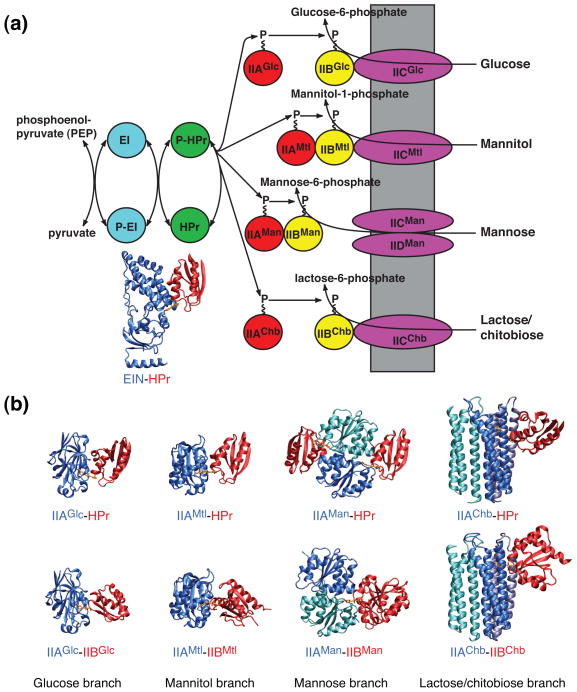
Fig. 1.
Summary of the PTS signal transduction pathway. (a) The first two steps are common to all branches of the pathway. Thereafter the pathway splits into four sugar-specific classes: glucose, mannitol, mannose and lactose/chitobiose. (b) Ribbon diagrams of the structures of the nine cytoplasmic complexes of the E. coli PTS. EIN-HPr [42] (shown in panel A); IIAGlc-HPr [47]; IIAMtl-HPr [45]; IIAMan-HPr[48]; IIAChb-HPr [49]; IIAGlc-IIBGlc [19]; IIAMtl-IIBMtl [50]; IIAMan-IIBMan [20]; IIAChb-IIBChb [51].

