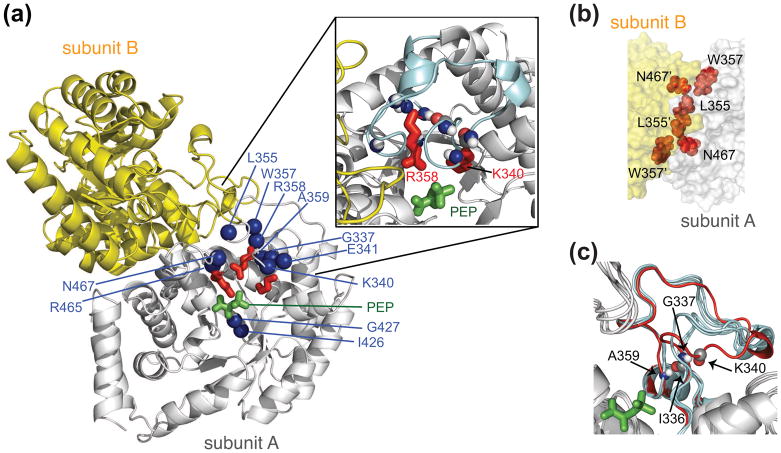
Fig. 6.
Structure and dynamics of the isolated EIC dimer. (a) Structural model of the E. coli EIC-PEP complex derived from the crystal structures of the T. tengcongensis EIC-PEP complex [68] and the E. coli phosphorylated EI intermediate [33]. One subunit is in grey, the other in yellow. PEP is in green; the side chains of Lys340, Arg358 and Arg 465 in red; and backbone nitrogen atoms exhibiting significant relaxation dispersion, characteristic of motion on the submillisecond to millisecond time scale, in blue. The inset shows a close-up of the β3α3 turn. (b) Close-up view of the EIC dimer interface. (c) Superposition of the crystal structures of EIC [33–35] [67, 68], illustrating the conformational variability of the β3α3 turn, with the closed conformation of the β3α3 turn seen in the crystal structure of the trapped phosphorylated EI intermediate in red. (D) The overall exchange rate between major (97%) and minor (3%) species determined by 15N-NMR relaxation dispersion spectroscopy is ~1550 s−1. The 15N chemical shift differences between the major and minor species determined from relaxation dispersion on free EIC correspond closely to the differences in chemical shifts between free EIC and EIC complexed to PEP, strongly suggesting that the minor species represents the closed conformation of the β3α3 turn. Adapted from [71].

