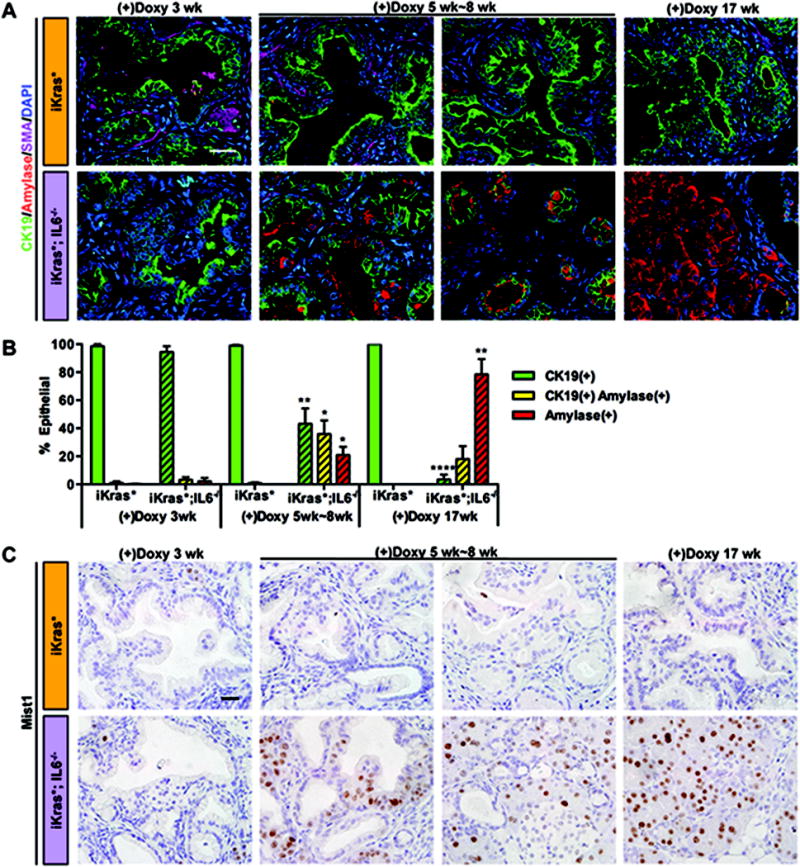
Figure 4. IL6 inhibition results in ductal-to-acinar re-differentiation of PanIN cells.

(A) Co-immunofluorescence staining for CK19 (green), amylase (red), SMA (magenta) and DAPI (blue). Scale bar 25μm. (B) Quantification of CK19 and amylase single or double positive epithelial cells in iKras* and iKras*;IL6−/− mice pancreata. Data represent mean ± SEM, n=3. The statistical difference was determined by two-sided Student’s t-test. For each time point, the number of single or double-positive cells was compared between genotypes. *p<0.05, **p<0.01, ****p<0.0001. (C) Mist1 immunohistochemistry staining. Scale bar 25μm.
