
Figure 4.
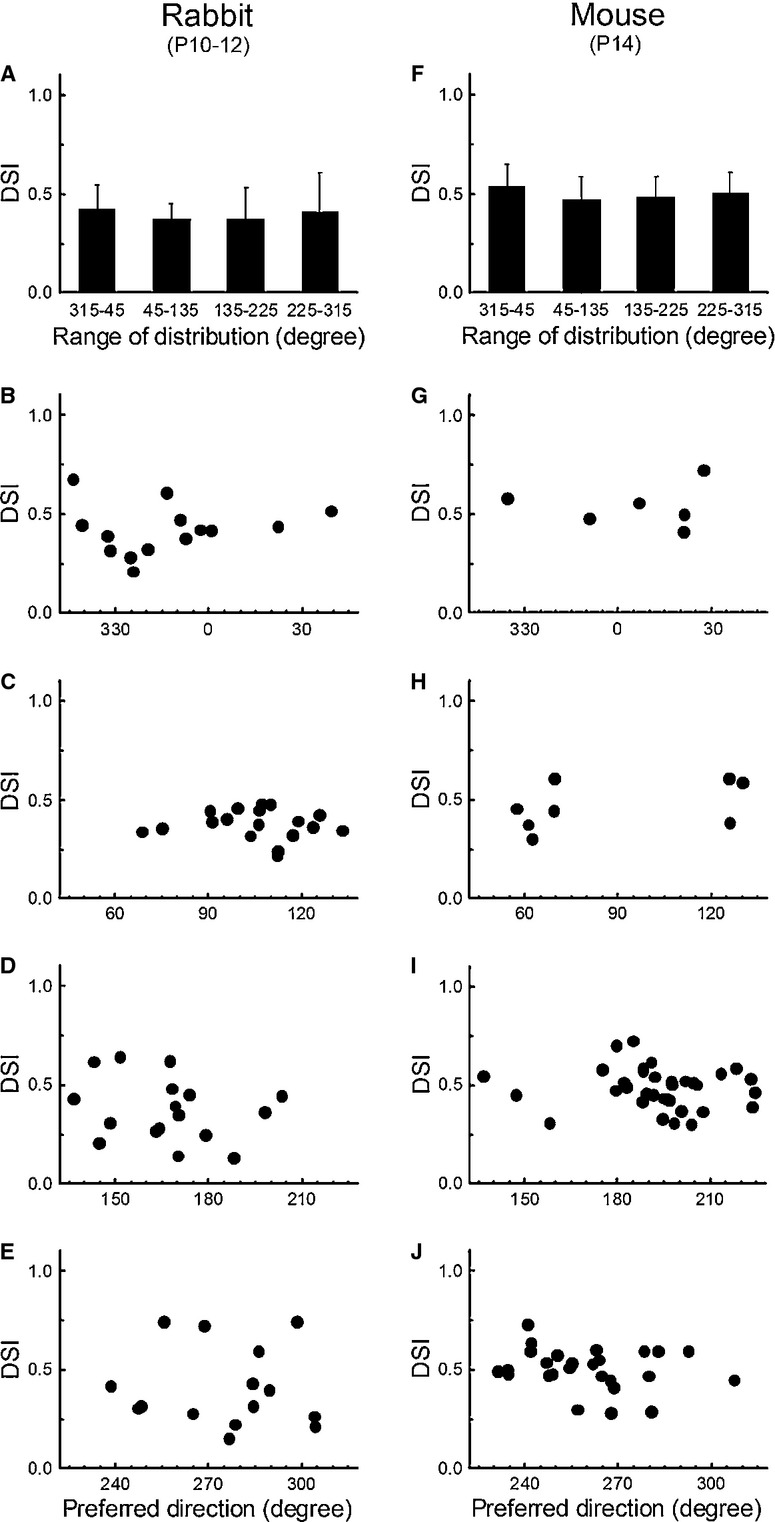
The preferred direction distributions of the direction selective ganglion cells (DSGCs) at around the time of eye opening are independent of the tuning strength of their direction selectivity. (A) and (F) Average direction selectivity indexes (DSIs) of the DSGCs whose preferred directions fell within the ranges of four canonical axes (0, 90, 180, and 270°) in postnatal rabbits and mice (mouse data from Elstrott et al. 2008). Error bars indicate SD. (B–E) and (G–J) Scatter plots of the DSIs of the DSGCs whose preferred directions are distributed across each of four canonical axes in postnatal rabbits and mice.