
Figure 6.
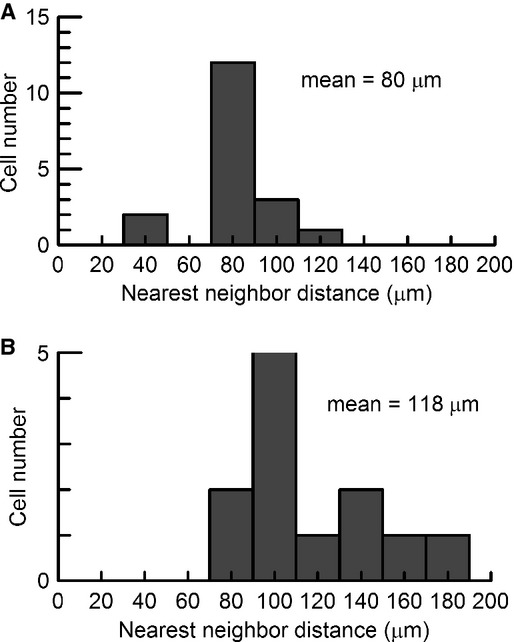
The nearest neighbor analysis of tracer coupled DSGCs shown in Figure 5. (A) The DSGC and its 17 coupled cells shown in Figure 5A had an average nearest neighbor distance of 80 ± 4 μm. (B) The DSGC and its 11 coupled cells shown in Figure 5B had an average nearest neighbor distance of 118 ± 9 μm. The apparent exclusion zone of the nearest neighbor distance histogram suggests that the coupling is homologous in DSGCs. Note that the gap in the histogram of (A) was due to small sampling size.