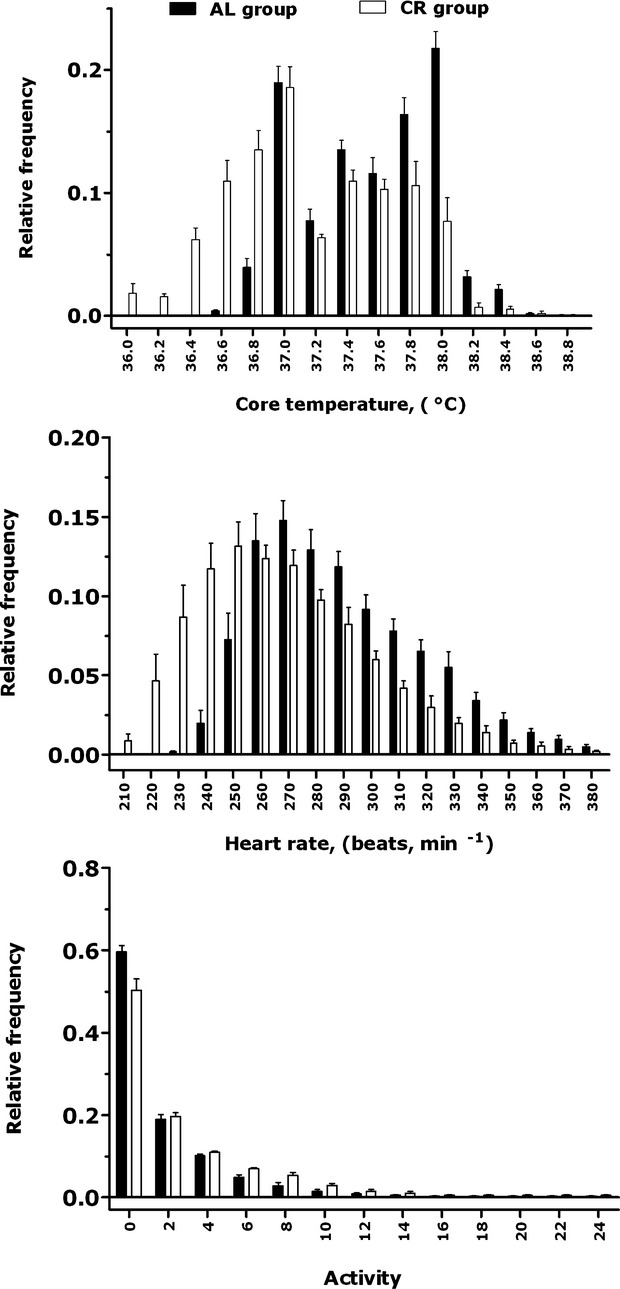
Figure 6.

Frequency distribution of core temperature, heart rate, and motor activity during the fourth week of caloric restriction. Data plotted as mean ± SE. N = 6 for AL and N = 5 for CR.

Frequency distribution of core temperature, heart rate, and motor activity during the fourth week of caloric restriction. Data plotted as mean ± SE. N = 6 for AL and N = 5 for CR.