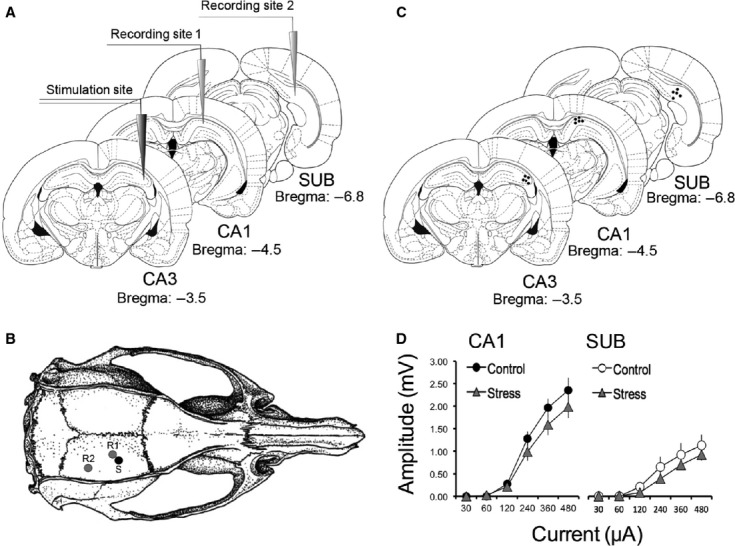
Figure 1.

(A) A schematic of the experimental design with stimulating electrode placed in dorsal CA3 and recording electrodes placed in dorsal CA1 and subiculum (SUB). (B) A rendering of a rat skull and the positions of the bored holes for the placements of the stimulating (S) and the two recording (R1 and R2) electrodes. Adapted from Paxinos and Watson (1997). (C) Representative electrode placements in the three regions of interest as indicated by black dots. (D) Input/output curves for CA1 (left) and SUB (right) for control and stressed rats obtained prior to the initial PPF recordings.
