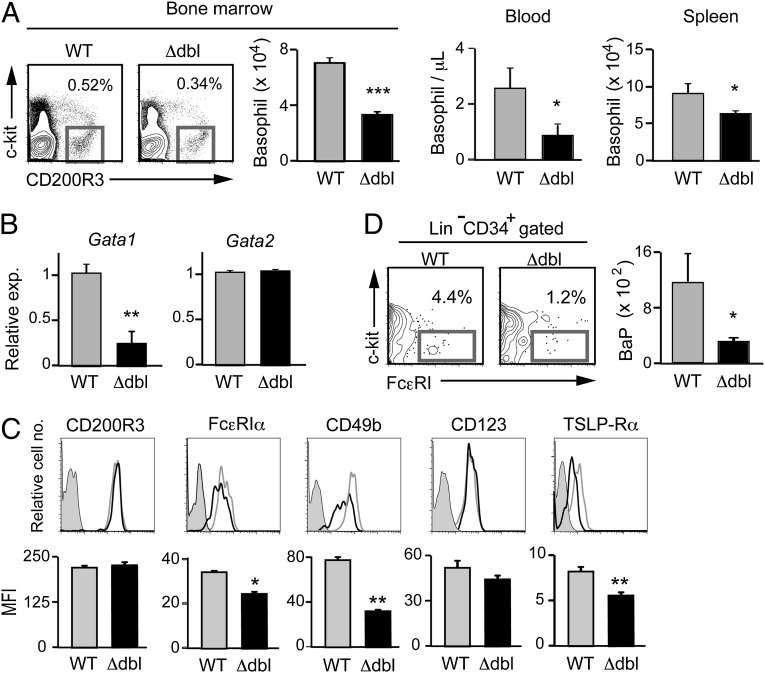
Fig. 2.
ΔdblGATA BALB/c mice show basophilopenia with a reduced number of basophil progenitors. (A) Numbers of basophils, defined as FSClowSSClowCD200R3+c-kit− cells, in the bone marrow, peripheral blood, and spleen of wild-type (WT) and ΔdblGATA (Δdbl) BALB/c mice (mean ± SEM, n = 3 each). (B) Basophils isolated from the bone marrow of WT and Δdbl mice were subjected to RT-PCR analysis. The relative expression of Gata1 and Gata2 mRNAs is shown (mean ± SEM, n = 4 each); the level of expression in WT basophils is set as 1. (C) Cell surface phenotype of bone marrow basophils isolated from WT and Δdbl mice. Representative staining profiles are shown (Upper); gray, black, and shaded histograms indicate those of WT and Δdbl basophils and control staining with isotype-matched antibodies, respectively. MFI of each surface marker is shown (Lower) (mean ± SEM, n = 4 each). (D) Numbers of basophil progenitors (BaP) in the bone marrow of WT and Δdbl mice (mean ± SEM, n = 4 each). Data in A−D are representative of three independent experiments. *P < 0.05; **P < 0.01; ***P < 0.001.

